

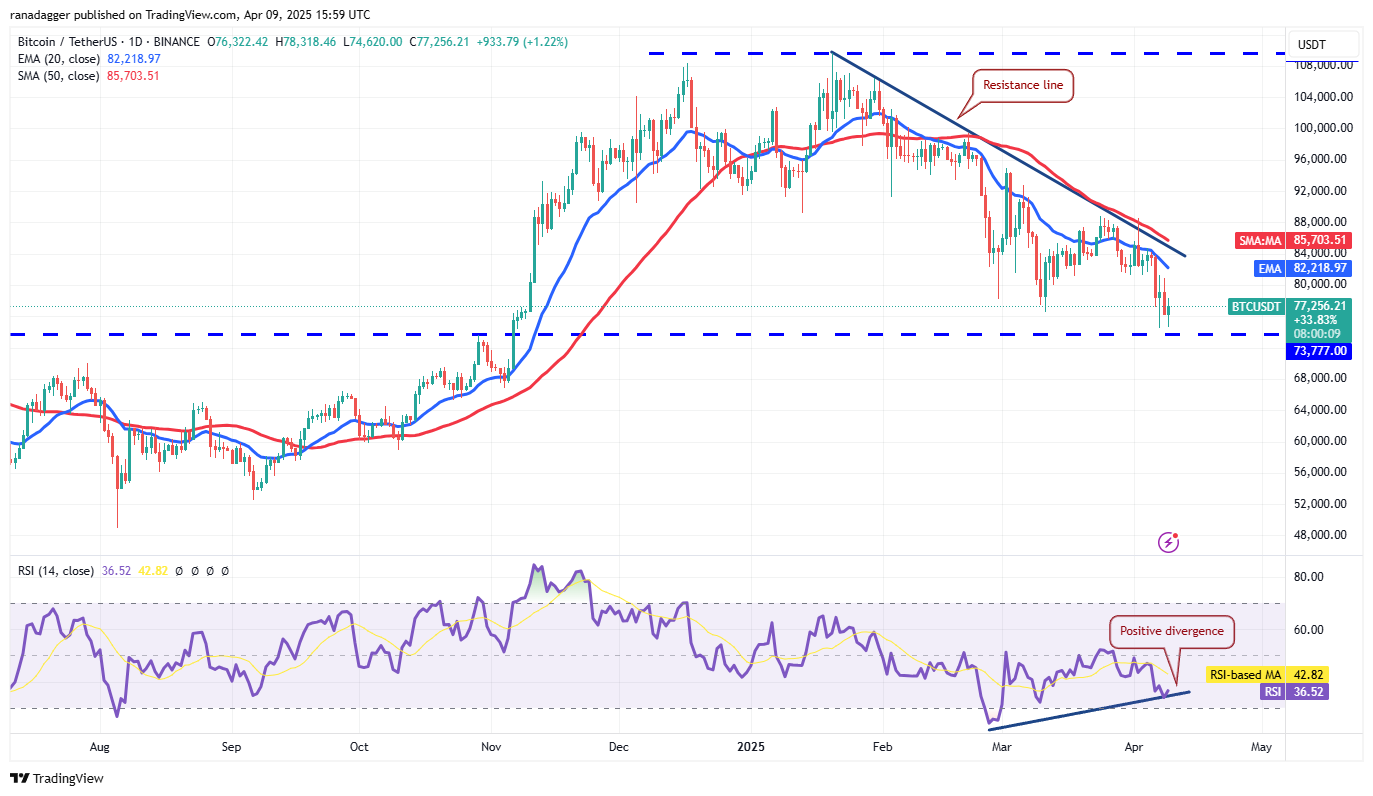
Risky assets continue to exhibit volatility amid escalating trade tensions between the United States and China, keeping investors anxious. A sliver of good news is that Bitcoin (BTC) has managed to stay above the crucial near-term support level of $73,777, avoiding a significant drop.
Arthur Hayes, a co-founder of BitMEX, shared on X that the People’s Bank of China (PBOC) could catalyze the next phase of the crypto bullish trend by devaluing the yuan. Such actions previously led to funds flowing into Bitcoin during 2013 and 2015, and it may repeat in 2025.
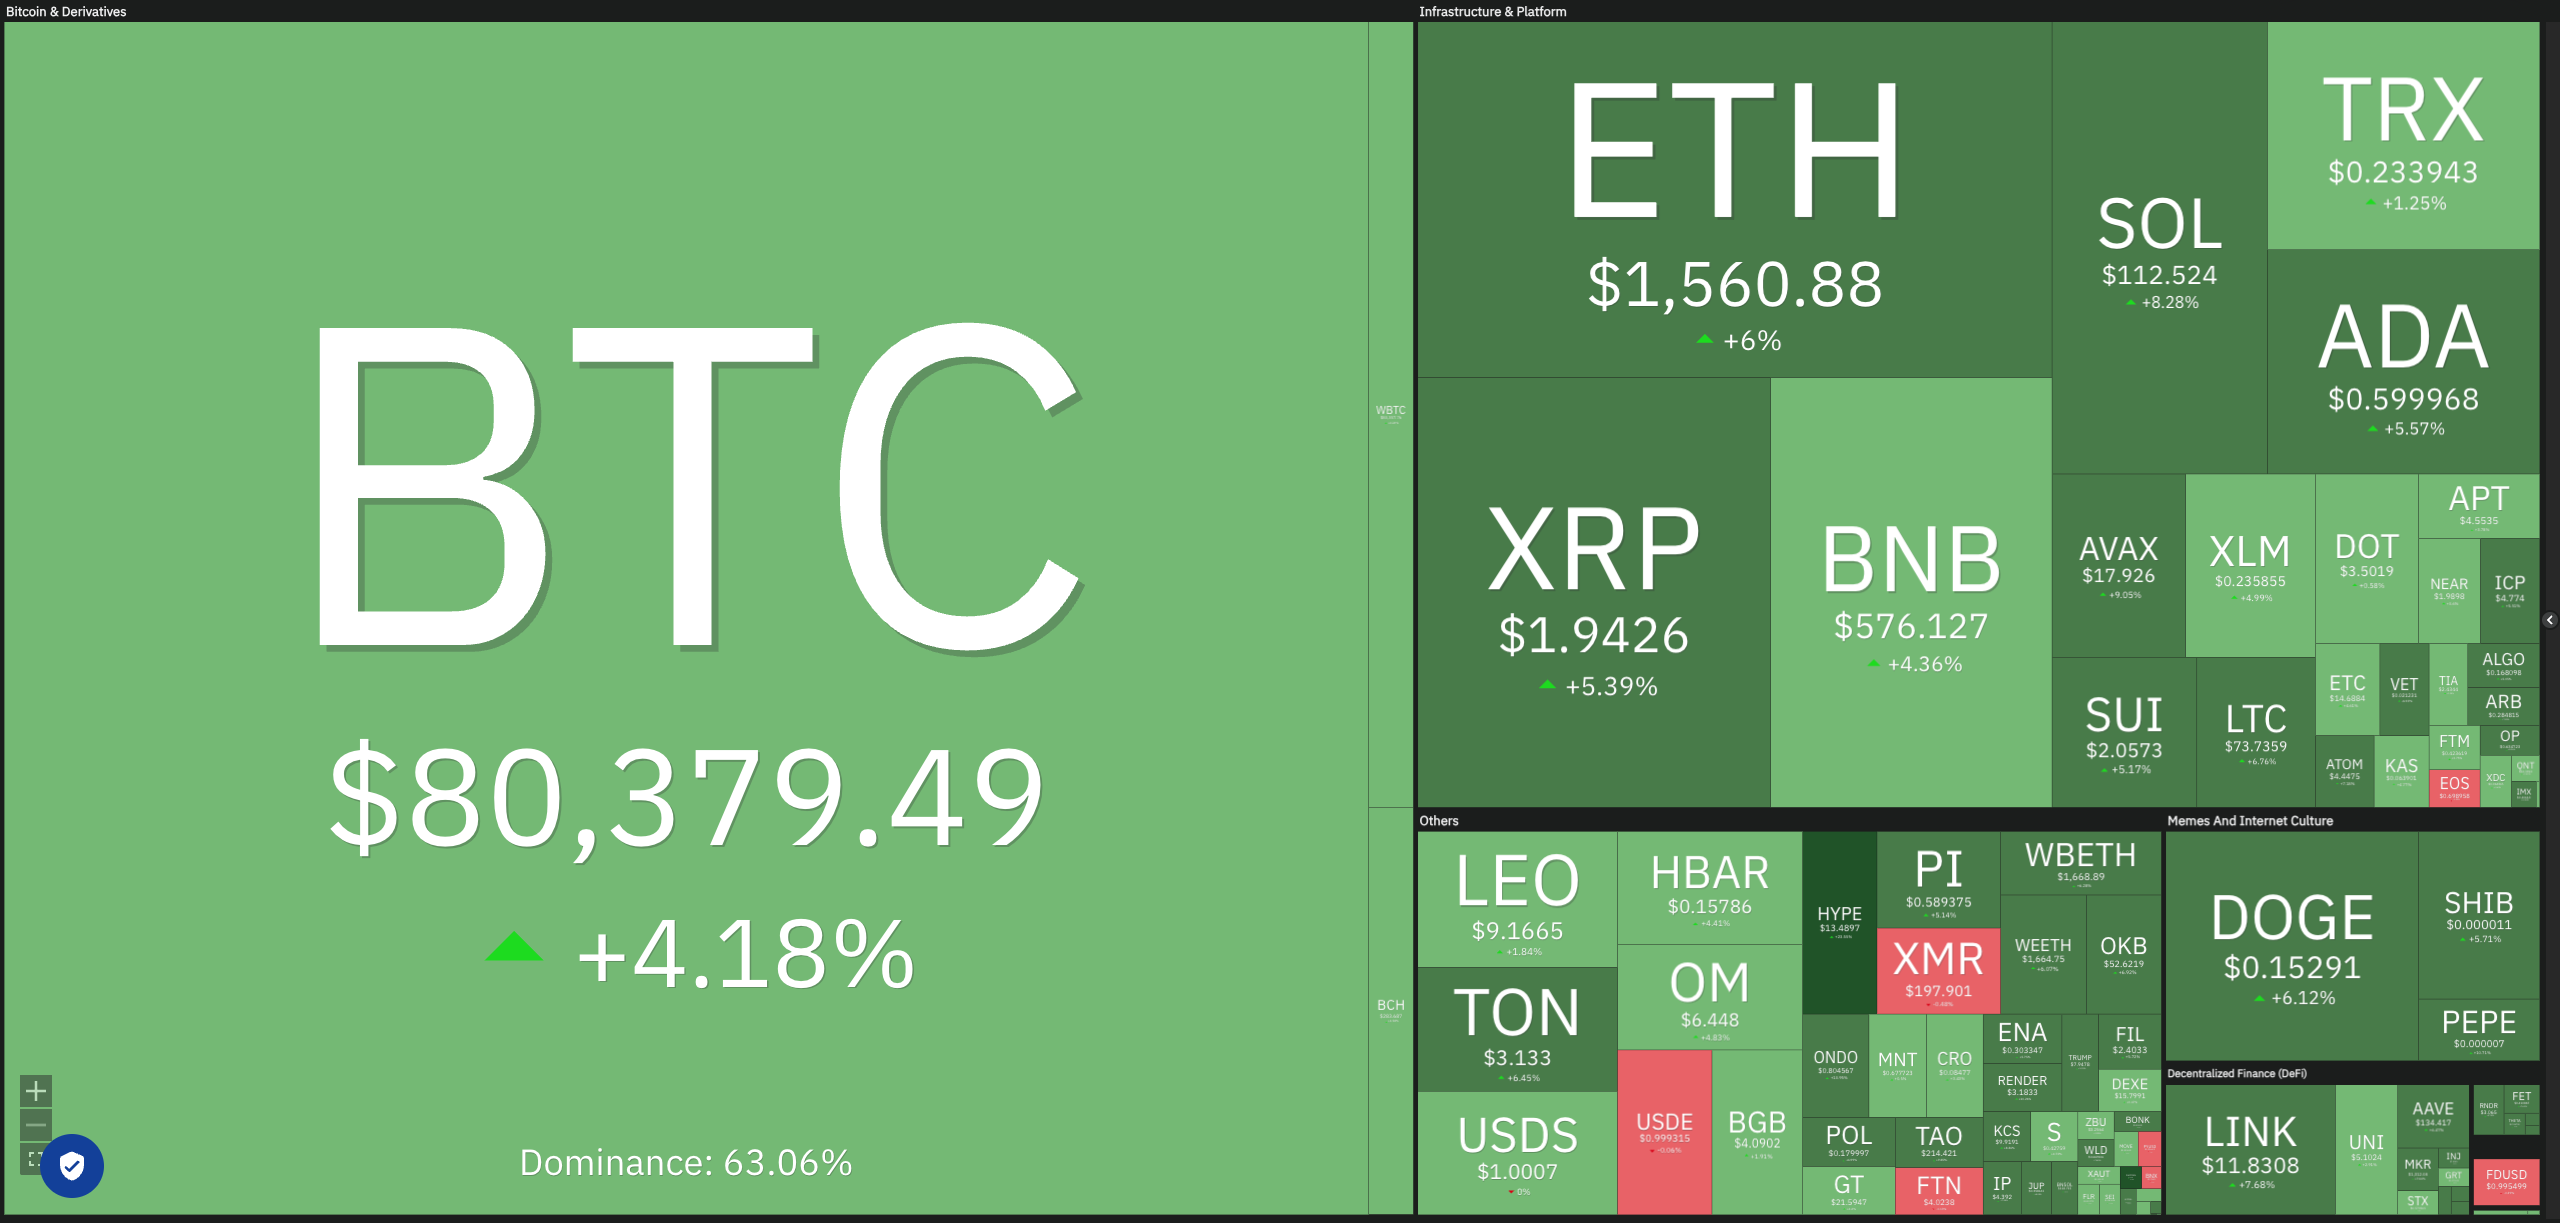
Daily view of crypto market data. Source: Coin360
The current market climate is unpredictable and fluid, prompting investors to reduce their risk exposure. Evidence of this includes a reported $595.9 million in outflows from US-listed spot Bitcoin exchange-traded funds over the past four trading days, according to Farside Investors data.
Will Bitcoin maintain its position above the $73,777 support level, or will bearish forces drive the price down? How are altcoins faring in comparison? Let’s examine the charts of the leading 10 cryptocurrencies to find out.
Bitcoin Price Analysis
On April 8, Bitcoin attempted a recovery but faced significant selling pressure near the 20-day exponential moving average ($82,218). This suggests that market sentiment remains bearish, with traders opting to sell during upticks.
BTC/USDT daily chart. Source: TradingView
The downward trend in moving averages gives an advantage to sellers, while the positive divergence in the relative strength index (RSI) indicates a potential slowdown in bearish momentum. Nevertheless, if the $73,777 support fails, the BTC/USDT pair may plummet to the next support level at $67,000, where significant buying interest is expected in the $67,000 to $65,000 range.
Additionally, the 50-day simple moving average ($85,703) is the key resistance level to monitor. Buyers must push the price above this level to indicate that the corrective phase might be over. Until such a move occurs, rallies are likely to be exploited by sellers.
Ether Price Analysis
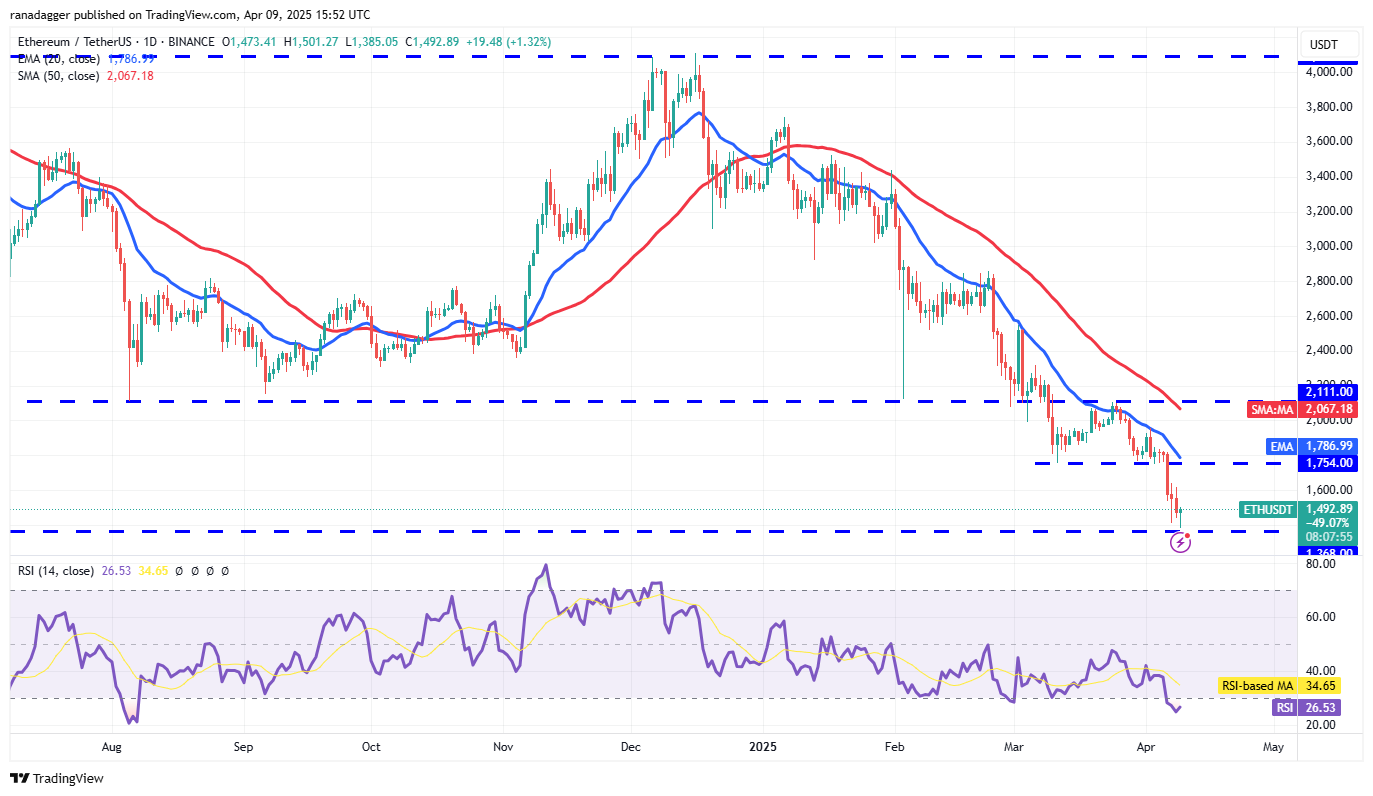
Ether (ETH) has been in a strong downtrend but has reached a critical support level at $1,368, which could initiate a relief rally.
ETH/USDT daily chart. Source: TradingView
The ETH/USDT pair could potentially rise to the 20-day EMA ($1,786), which may present a tough barrier. If the price declines from this level, bears will attempt to push the pair below $1,368. A successful breach could see the pair fall to $1,150.
Conversely, if the price rebounds off $1,368 after a decline from the 20-day EMA, it could indicate a range-bound trading pattern. A decisive break and close above the 20-day EMA would signal a loss of control by the bears, allowing the pair to rise to the breakdown level of $2,111.
XRP Price Analysis
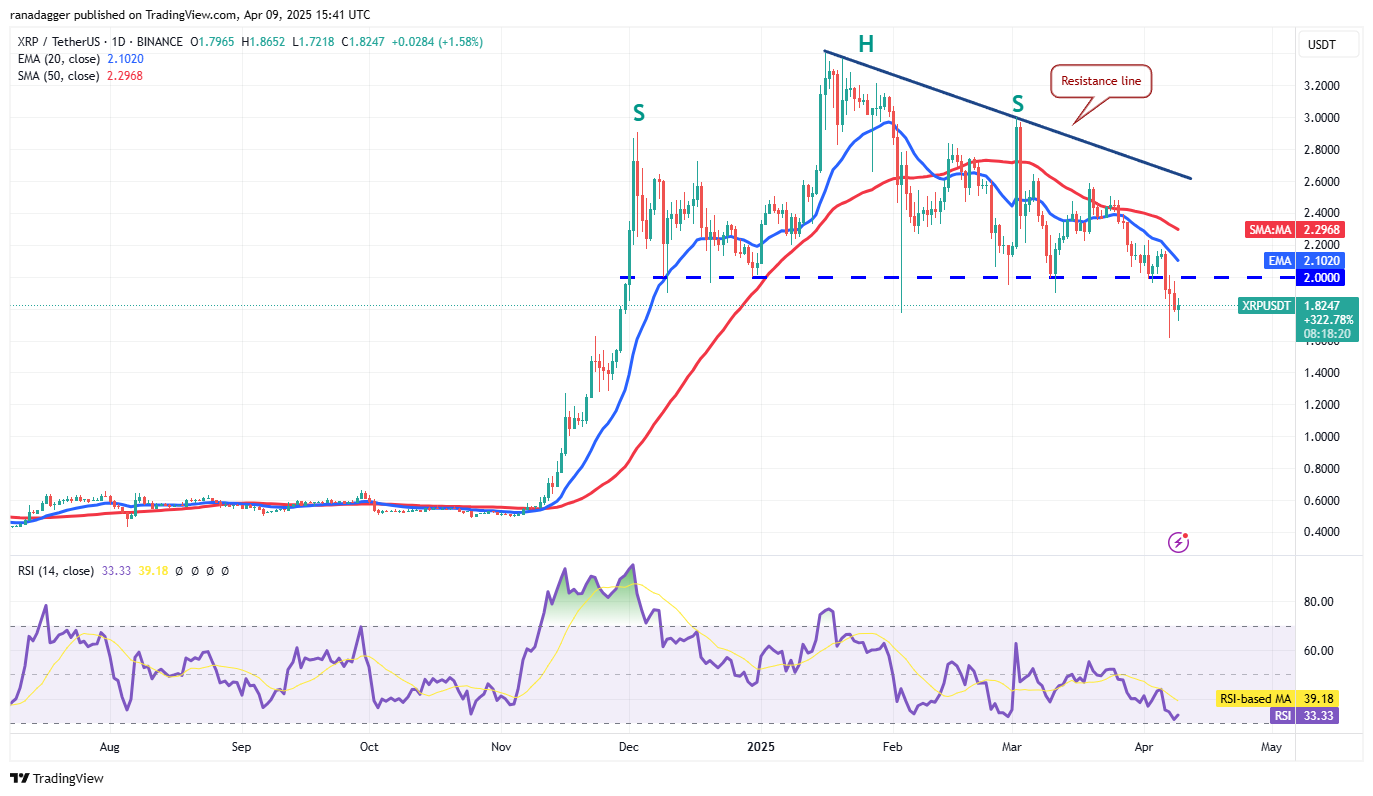
XRP (XRP) attempted to surpass the breakdown level of $2 on April 8 but encountered strong resistance from bears. This indicates that sellers are trying to convert this level into resistance.
XRP/USDT daily chart. Source: TradingView
If the price turns down and breaks below $1.61, the XRP/USDT could resume its downtrend, with the next support level located at $1.27.
On the other hand, if buyers manage to push the price above the 20-day EMA ($2.10), it would suggest a solid demand at lower levels. There is a minor obstacle at the 50-day SMA, but it is expected to be surpassed. If this occurs, the pair could ascend to the resistance line, where aggressive selling by bears is anticipated.
BNB Price Analysis
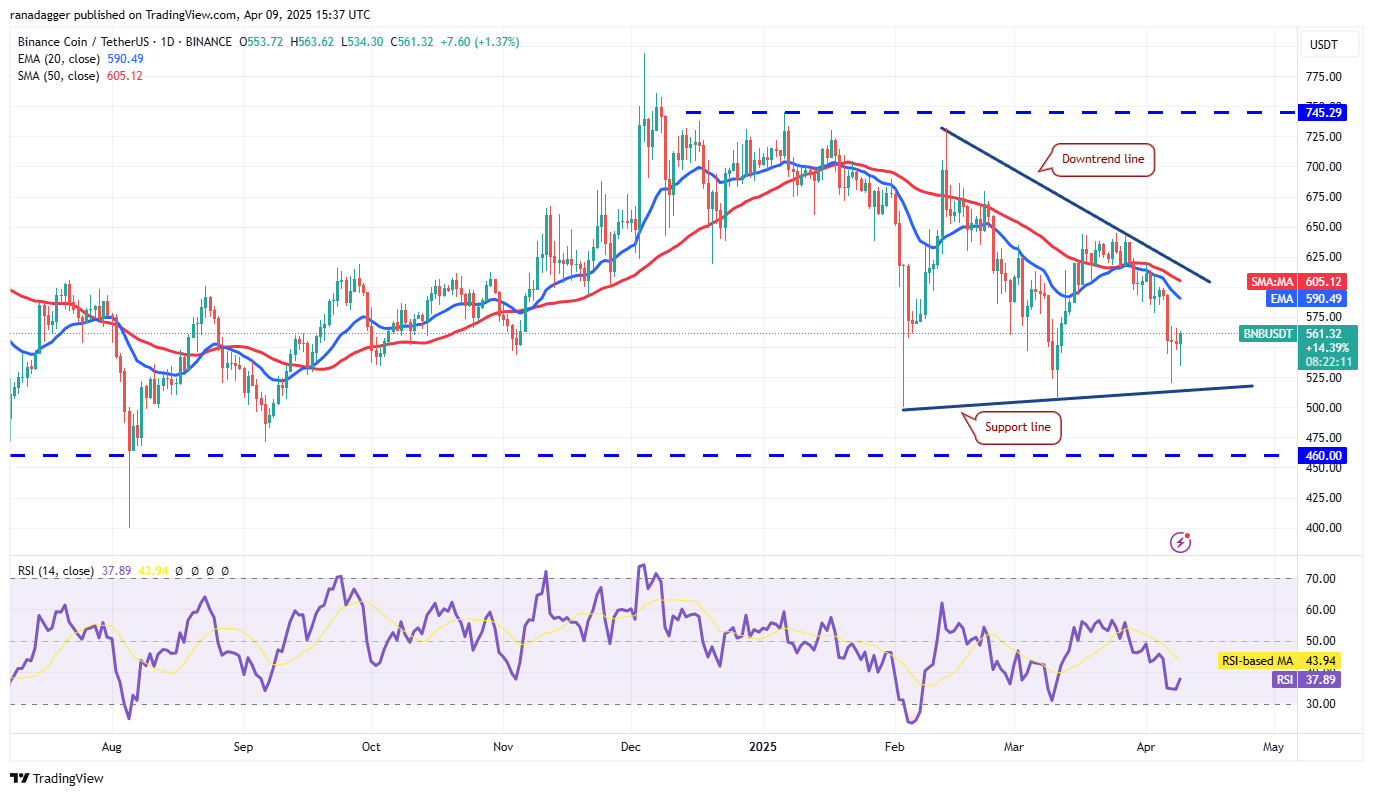
BNB (BNB) is working on establishing a higher low at $520, revealing strong purchasing interest from bulls at lower price points.
BNB/USDT daily chart. Source: TradingView
The bulls will aim to push the price toward the downtrend line, which is anticipated to act as a significant barrier. If the price fails to break the downtrend line, it will indicate that bears are reasserting their control at higher levels. The BNB/USDT pair may continue to fluctuate within the triangle pattern for the time being.
Keep an eye on the support line as a critical level to monitor. A break and close below this line may lead to a drop to $460. Buyers are expected to defend the $460 threshold vigorously, as a decline below it could see the pair tumble to $400.
Solana Price Analysis
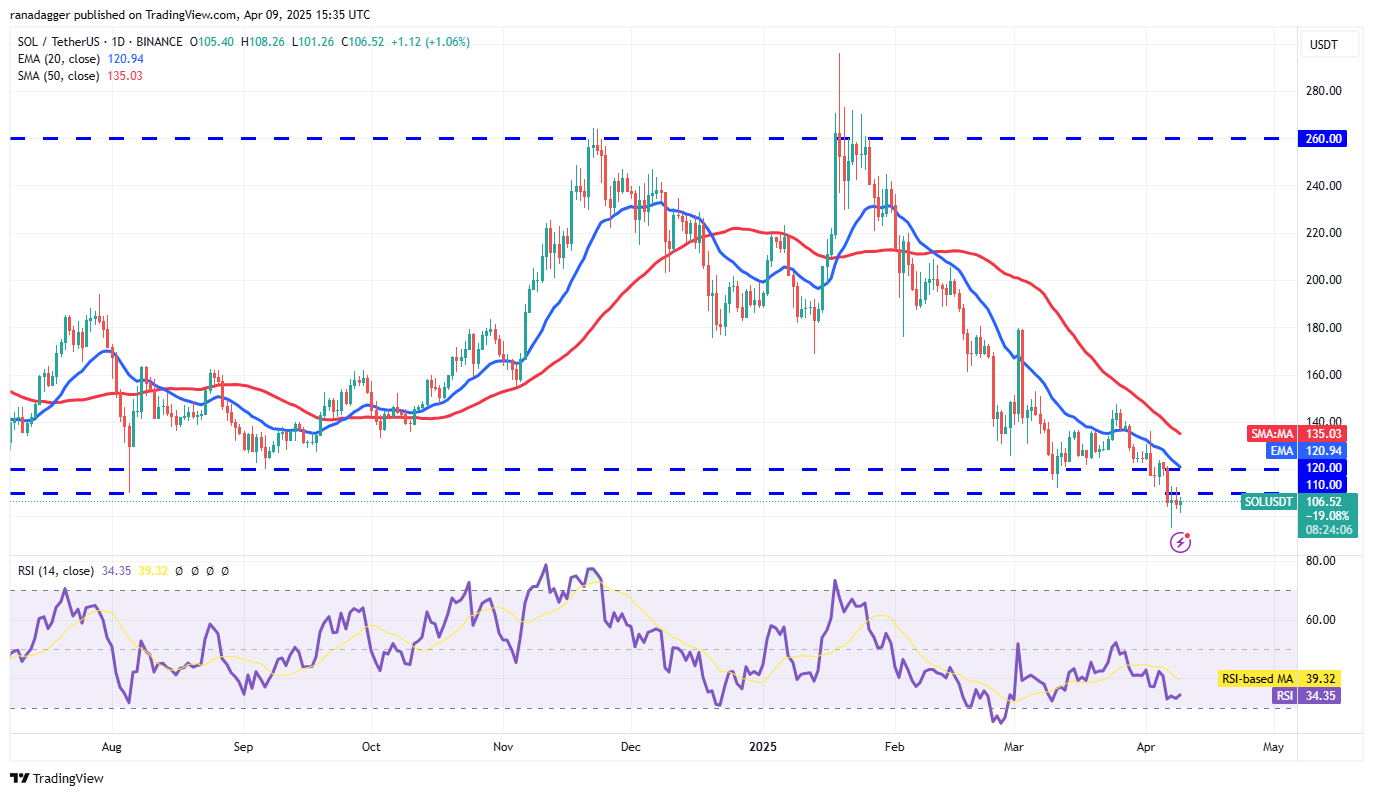
Solana (SOL) is currently trading beneath the $110 support level, but bears have not initiated a downward push, indicating a lack of aggressive selling at these prices.
SOL/USDT daily chart. Source: TradingView
Buyers are expected to encounter significant resistance within the $110 to $120 range. Should the price decline from this region, it would signal that bears are still active sellers during rallies, increasing the likelihood of a fall below $95. In such a scenario, the SOL/USDT pair might drop to $80.
Alternatively, a break and close above $120 indicates that bears have been rejected, suggesting renewed strength in the markets. While the 50-day SMA ($135) might pose resistance, it is likely to be surpassed. The pair could then rise to $147 and possibly up to $180 thereafter.
Dogecoin Price Analysis
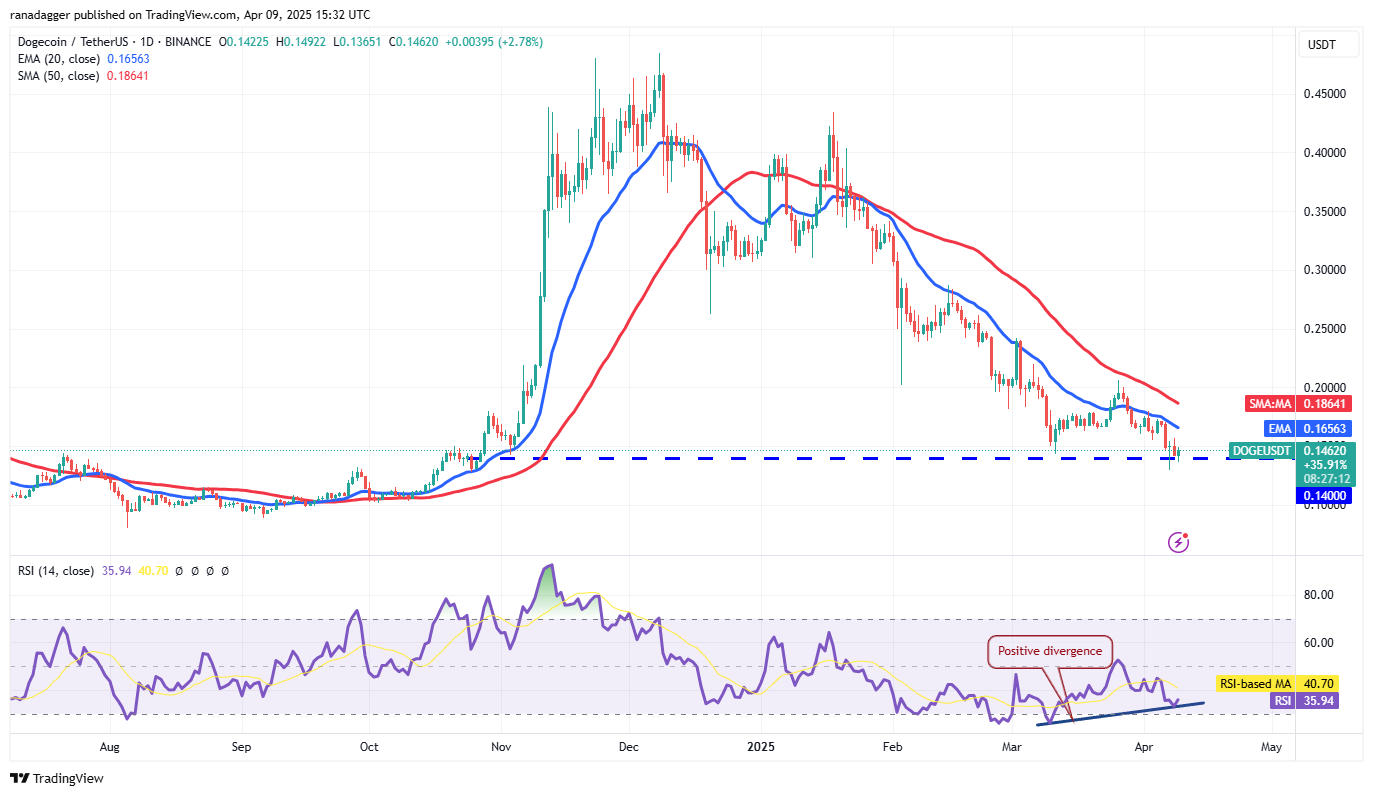
Dogecoin (DOGE) is currently experiencing a fierce contest between bulls and bears around the $0.14 support level.
DOGE/USDT daily chart. Source: TradingView
While the descending moving averages indicate a bearish advantage, the positive divergence in the RSI suggests that selling pressure may be easing. However, if the price falls and maintains below $0.14, it could trigger renewed selling momentum, with the next downside target at $0.10.
Conversely, if the price breaks and closes above the resistance level at $0.20, it may confirm the formation of a double bottom pattern. This could allow the DOGE/USDT pair to rally to $0.24 and eventually reach the pattern target of $0.26.
Cardano Price Analysis
Buyers are attempting to keep Cardano (ADA) above the $0.50 support, although they will likely face selling pressure on any minor rallies.
ADA/USDT daily chart. Source: TradingView
If the price declines from the 20-day EMA ($0.65), it raises the possibility of falling below $0.50. Should this happen, the ADA/USDT pair may dip to $0.45 and subsequently to $0.40. Buyers are expected to defend the $0.30 to $0.40 support range strongly.
A key signal of strength will be a break and close above the 20-day EMA. If this occurs, the pair could rise to the 50-day SMA ($0.72), which bears will seek to defend, as a breach above it would imply a shift in the short-term trend.
Note: Bitcoin’s price could face risks of reaching a new 5-month low near $71K if trade tensions and market volatility continue unabated.
UNUS SED LEO Price Analysis
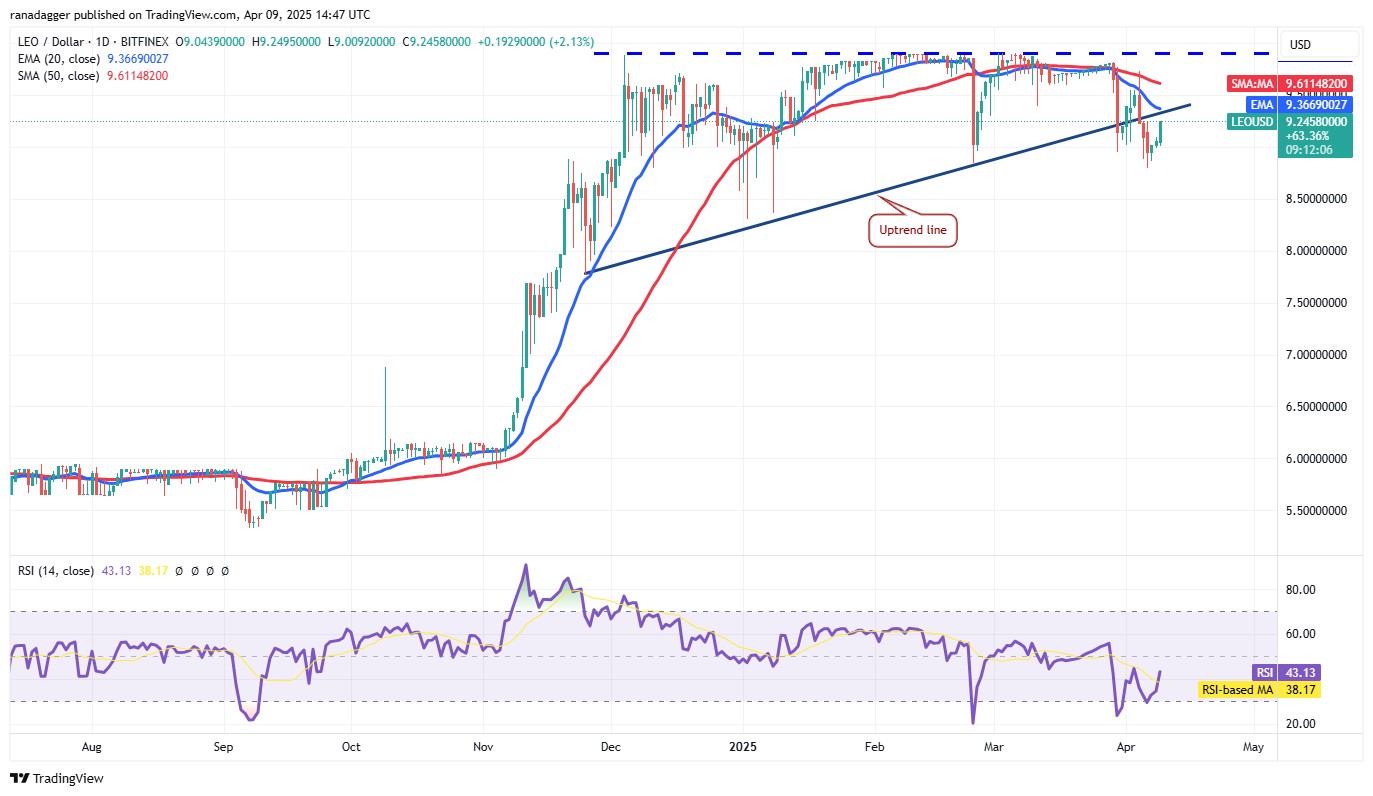
UNUS SED LEO (LEO) has begun a recovery, but it is likely to encounter selling pressure at the 20-day EMA ($9.36).
LEO/USD daily chart. Source: TradingView
If the price declines from the 20-day EMA, it will signal a shift in sentiment toward the negative, with traders opting to sell during rallies. This could increase the chance of a break below the $8.80 support level. If this occurs, the LEO/USD pair could slide to $8.30.
In contrast, if the price rises and remains above the 20-day EMA, it indicates healthy demand at lower levels. The bulls would then likely aim for the resistance level at $9.90.
Chainlink Price Analysis
Chainlink (LINK) has retraced to the support line of a descending channel pattern, where buyers are anticipated to step in.
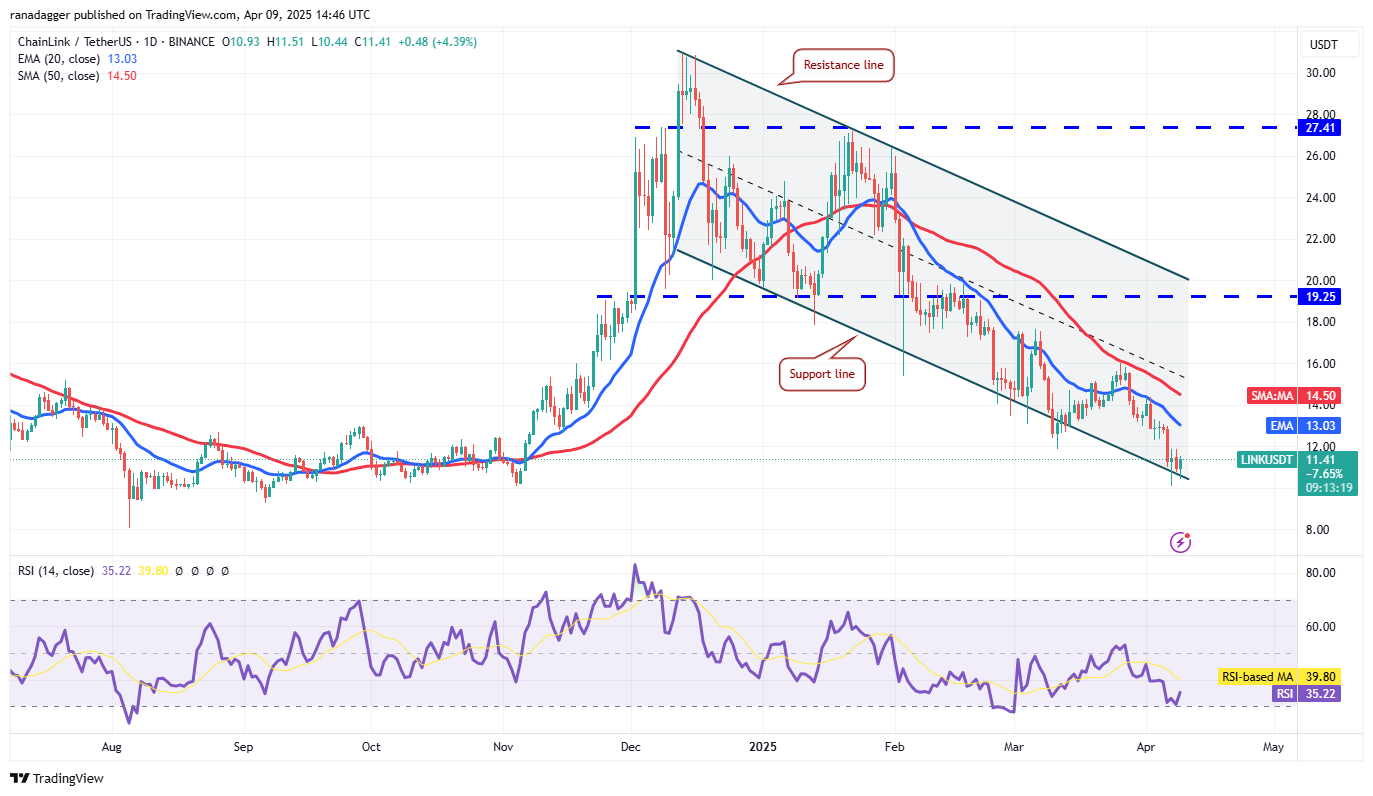
LINK/USDT daily chart. Source: TradingView
A rebound off this support line is expected to face significant selling near the moving averages. If the price declines sharply from these averages, the LINK/USDT pair could drop below the support line, with the next target to the downside at $8.
Buyers face a challenging task ahead, needing to push the price above the 50-day SMA ($14.50) to suggest that bearish momentum is weakening. If they succeed, the price could rise toward the resistance line.
Toncoin Price Analysis
Toncoin (TON) has found support at $2.84, but the inability to trigger a strong rebound indicates a lack of demand from buyers.
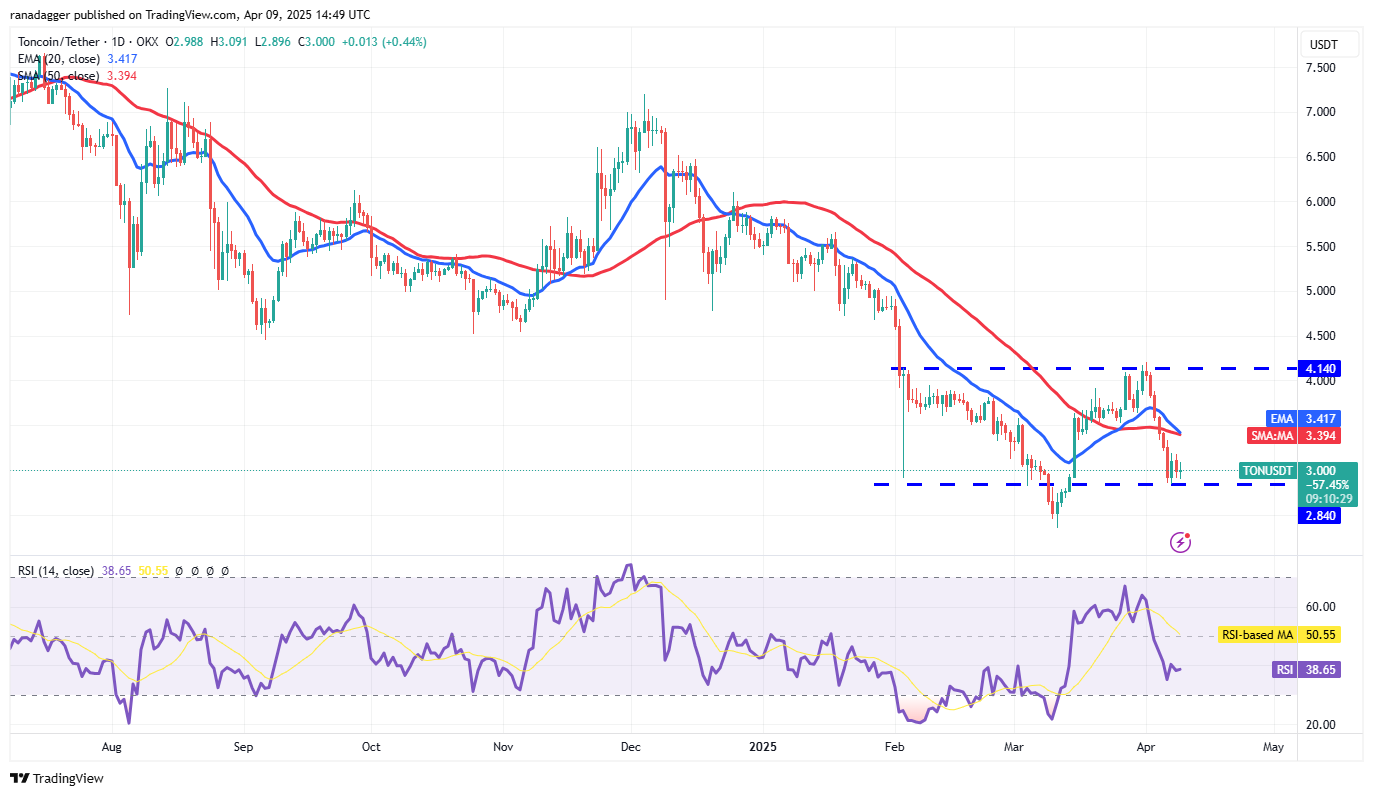
TON/USDT daily chart. Source: TradingView
The 20-day EMA ($3.41) is trending downward, and the RSI is in negative territory, indicating that bears hold the advantage. If the price dips below $2.84, the TON/USDT pair could fall to $2.35.
To avoid further downside, buyers must push and maintain the price above the moving averages. Achieving this could enable a rally to $4.14, where bears are anticipated to offer strong resistance.
This content does not provide investment advice or recommendations. Each investment and trading decision involves risks, and readers should conduct their own research before taking action.
