- The price of MANTRA is currently around $6.24 on Wednesday, reflecting a nearly 9% increase this week.
- The MANTRA chain has unveiled the MEF, launching with more than $108 million to foster innovation and growth in RWA tokenization.
- The technical indicators and on-chain data suggest that the rally will likely continue, with holders actively accumulating OM tokens.
The price of MANTRA (OM) is around $6.24 on Wednesday, having surged nearly 9% this week. On Monday, the MANTRA chain introduced the MANTRA Ecosystem Fund (MEF), which has over $108 million allocated to enhance innovation and development in Real-World Asset (RWA) tokenization. Even amidst a downturn in the wider cryptocurrency market, the technical analysis and on-chain indicators point towards a continuation of the rally, with holders accumulating OM tokens actively.
Launch of the MANTRA Ecosystem Fund
Monday marked the announcement from the MANTRA chain regarding the establishment of the MANTRA Ecosystem Fund, valued at $108,888,888, aimed at spearheading innovation in Real-World Asset tokenization. This news sparked a nearly 10% increase in the value of OM tokens that same day.
The fund’s objective is to connect traditional finance with Decentralized Finance (DeFi) by backing global blockchain initiatives over the next four years. It collaborates with prominent partners such as Laser Digital, Amber Group, and Brevan Howard Digital to utilize their extensive networks for identifying and investing in promising startups.
“If you are a founder, team, or developer with an idea aimed at bringing more of the world on-chain, let’s connect. The MEF is open to projects at any development stage across any chain,” stated the MANTRA team in their message.
This announcement reflects a positive outlook for OM, indicating robust institutional backing and belief in the MANTRA vision. Additionally, it enhances RWA tokenization, potentially attracting more investors towards OM tokens.
Today, we’re announcing the launch of the MEF – a $108,888,888 million investment initiative designed to propel real world asset innovation, adoption and growth. But we’re not doing this alone. We’ve got leading incubators, accelerators and capital partners by our side;… pic.twitter.com/oyeCOJ9QrE
— MANTRA | Tokenizing RWAs (@MANTRA_Chain) April 7, 2025
Examining the on-chain metrics reveals that holders are actively accumulating OM tokens. Data from Santiment indicates that whales took advantage of the recent price dip to buy more OM tokens.
According to Santiment’s Supply Distribution data, the number of whales holding between 100,000 to 1 million OM tokens increased from 29.34 million on Monday to 30.18 million on Wednesday.
Furthermore, wallets containing between 1 million to 10 million and 10 million to 100 million OM tokens rose from 258.55 million to 273.81 million and from 497.92 million to 584.74 million, respectively, over the same period.
This trend suggests that whales seized the opportunity to accumulate MANTRA at a discount during the recent price decline, reinforcing confidence among investors in OM.
OM Supply Distribution chart.
OM Price Prediction: Bulls Targeting a Double-Digit Rally
The price of MANTRA found support at its 100-day Exponential Moving Average (EMA) of $5.77 on Monday and subsequently experienced a rally of 9.44%. This level aligns with the daily support level of $5.79, defining a crucial support zone. As of Wednesday, the price remains around $6.24.
If OM maintains its upward trajectory, it might revisit its March 27 peak of $6.86. A successful closure above this level could lead to a further rally of 20% to reach its March 2 high of $8.23.
The Relative Strength Index (RSI) currently reads 46 on the daily chart, nearing its neutral level of 50, suggesting a reduction in bearish momentum. The RSI will need to surpass the neutral level of 50 for bullish momentum to persist. Additionally, the MACD indicator is on the verge of generating a bullish crossover on the daily chart, which would provide buy signals and indicate a potential upward trend.
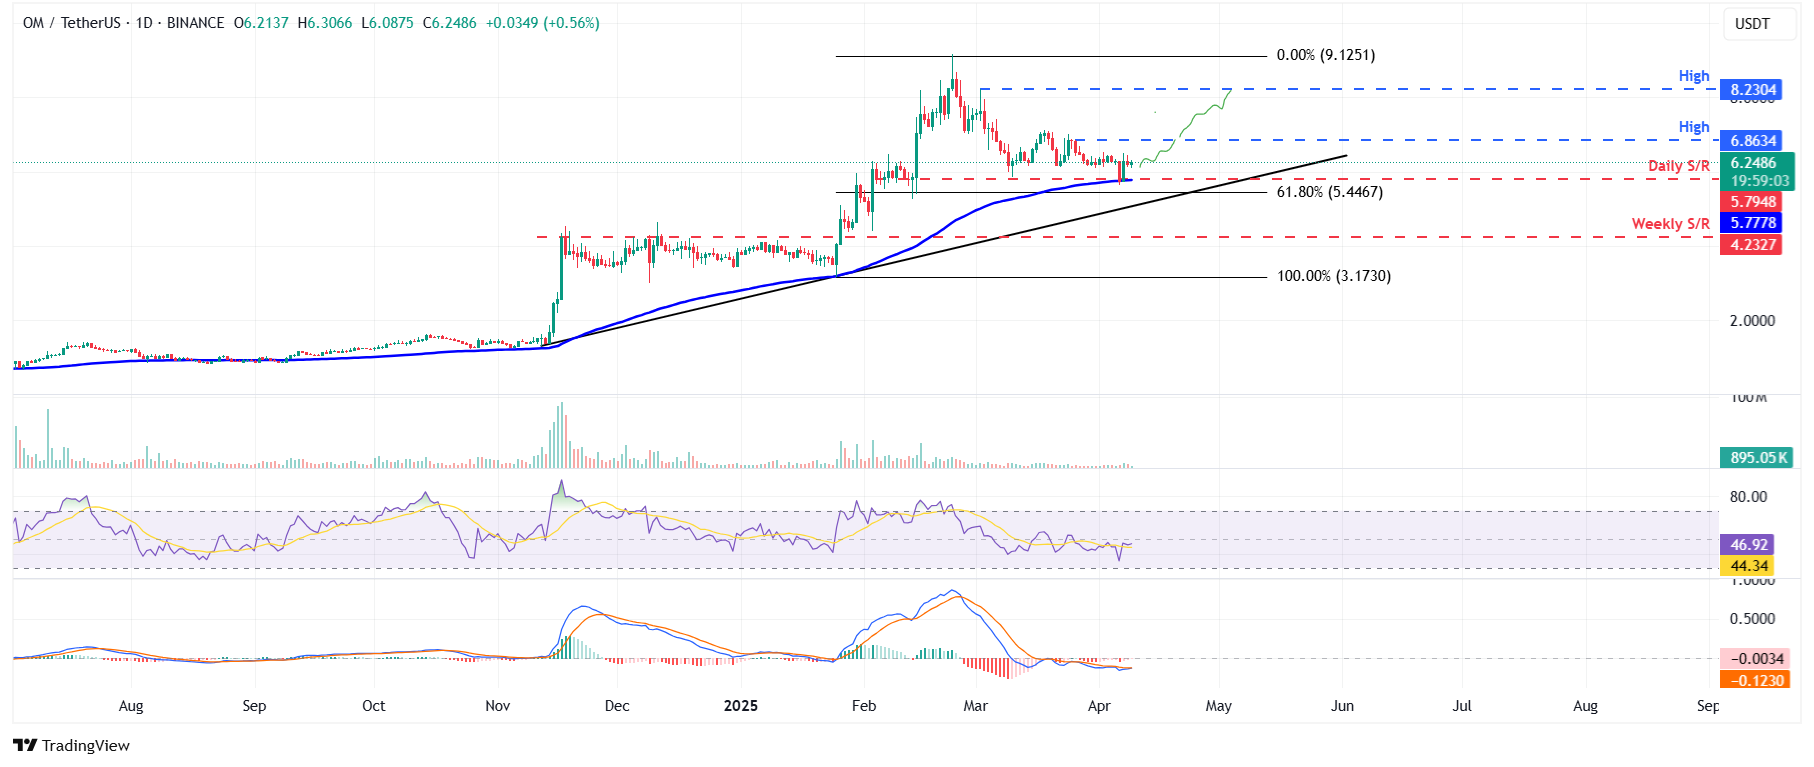
OM/USDT daily chart.