The price of XRP has surged by 13% today, trading above the $2 mark following an announcement from President Donald Trump regarding a 90-day halt on all reciprocal tariffs, with the exception of China, which experienced an added 125% increase in response to their counter-tariffs against the United States.
This rally in XRP coincides with other favorable developments, including the launch of the XXRP ETF on the New York Stock Exchange (NYSE) Arca.
However, despite the positive macroeconomic indicators and growing adoption of cryptocurrency within traditional finance, XRP’s charts signal the potential for a significant price decline in the near future.
Descending triangle pattern indicates a potential 33% drop
Since December 2024, XRP has been forming a possible triangle pattern on its daily chart, marked by a flat support level alongside a declining resistance line.
A descending triangle pattern that emerges after a strong upward trend is typically viewed as a bearish reversal signal. Generally, this pattern resolves when the price breaks through the flat support level, potentially resulting in a drop equal to the triangle’s maximum height.
The price dipped below the triangle’s support line at $2 on April 6, signaling a possible breakdown. In this scenario, the price could fall to around $1.20 by the end of April, reflecting a 33% decline from current levels.
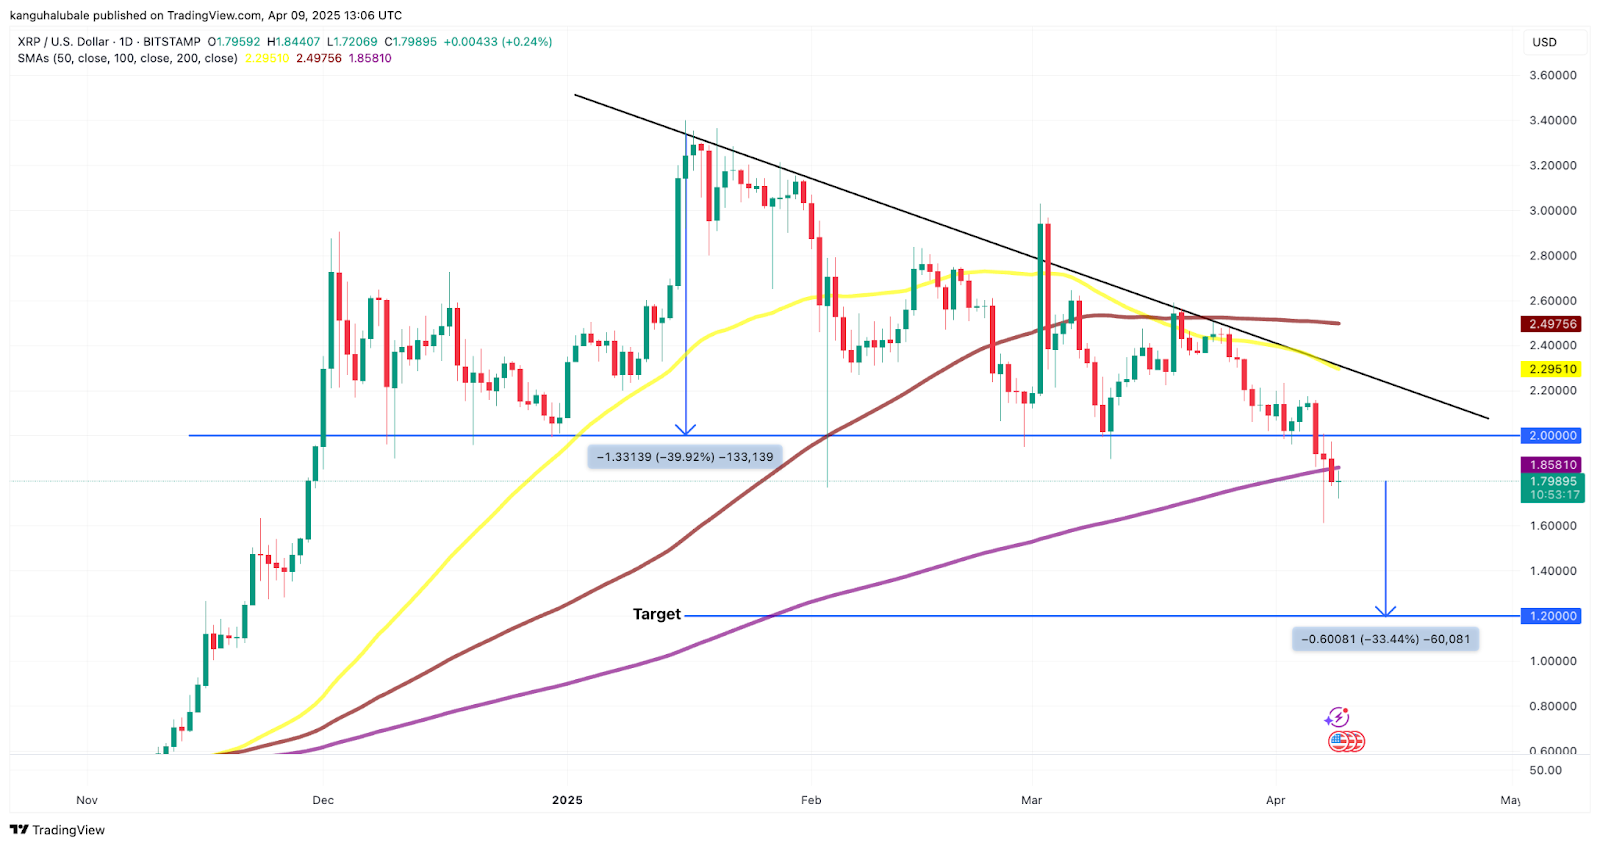
XRP/USD daily chart. Source: TradingView
The target suggested by the descending triangle aligns with a prediction from trader CasiTrade, who believes the altcoin could decrease to $1.55 based on a “textbook” Elliott Wave Theory analysis.
“Currently, breaking through $1.81 is crucial for this scenario,” the trader noted in an April 8 post, warning that a decline below this level could confirm a deeper downturn.
CasiTrades identified $1.71 as the next level to monitor, where the price may pause briefly before potentially reaching a “final low” of $1.55.
“Key zone: $1.55 is the golden retracement and likely the conclusion of this entire corrective wave.”
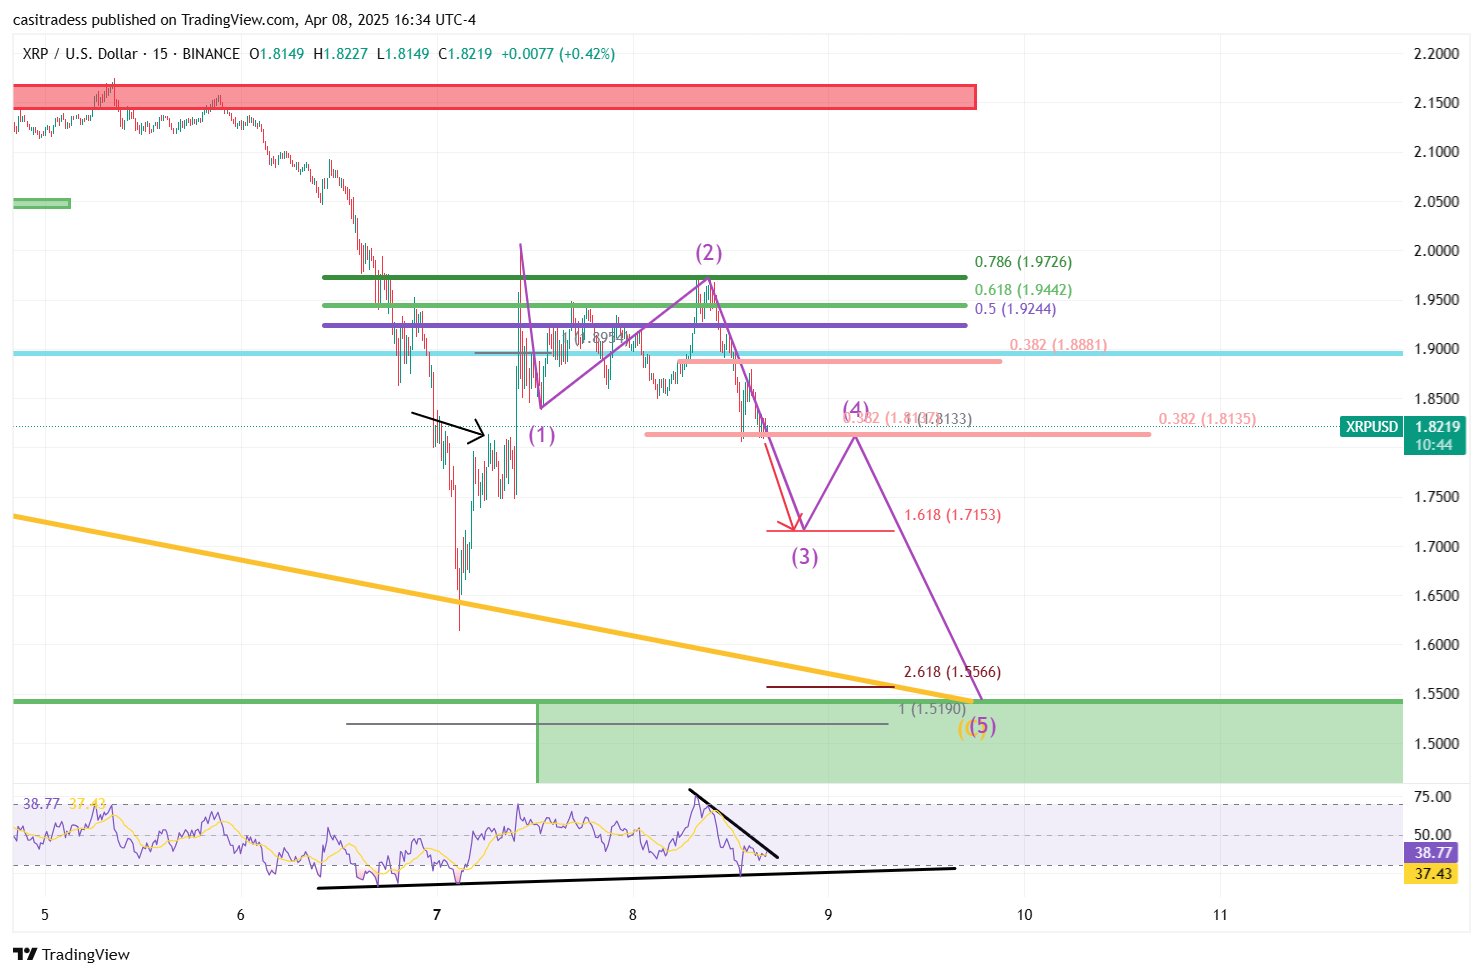
XRP/USD 15-minute chart. Source: CasiTrades
The bearish sentiment has been echoed by experienced trader Peter Brandt, who predicts that the price of XRP could fall to $1.07 due to a forming “textbook” head-and-shoulders pattern on the daily chart.
Related: Ripple’s acquisition of Hidden Road as a ‘defining moment’ for XRPL — Ripple CTO
Can the XXRP ETF launch prevent an XRP price decline?
Although the XXRP ETF launched on NYSE Arca on April 8, 2025, the price of XRP remains unstable due to a combination of market dynamics and escalating trade tensions.
This 2x leveraged ETF, intended to amplify XRP’s daily returns, debuted amid increased volatility, with XRP trading around $1.71 following a 7.4% drop in the past 24 hours.
On its first day, the XXRP ETF attracted $5 million in trading volume, a commendable figure given the ongoing turbulence in both cryptocurrency and global markets, according to Bloomberg ETF analyst Eric Balchunas.
Though this figure is significantly less than the first-day volume of BlackRock’s IBIT ETF, it still places XXRP in the top 5% of new ETF launches.
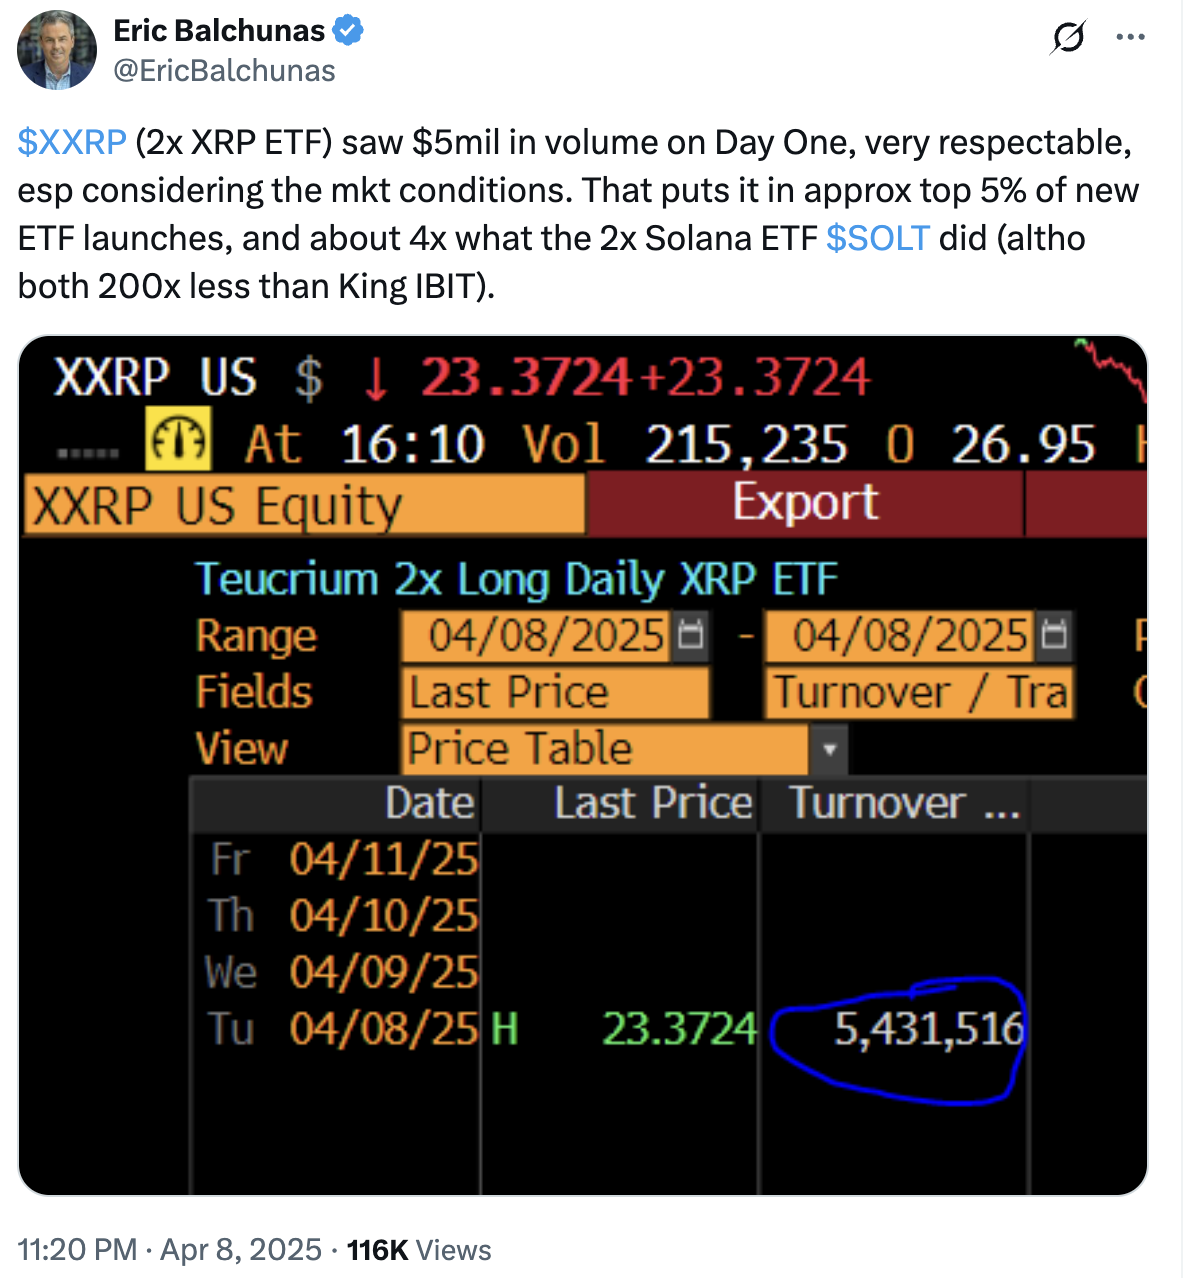
Source: Eric Balchunas
In addition to the XXRP ETF, macroeconomic conditions, particularly President Trump’s reciprocal tariffs, are central to the narrative this week and pose a threat of increased volatility across cryptocurrency markets.
This content does not constitute investment advice or recommendations. Every investment and trading action carries risk, and readers are encouraged to conduct their own research before making any decisions.