The latest decline in Ether (ETH) has resulted in a drop below the vital $1,500 support threshold. Various technical indicators imply that ETH may undergo a more significant correction before it can initiate a prolonged recovery.
Recent data indicates that Ether’s price has dipped underneath its realized price—a metric calculated on-chain that reflects the market value of a cryptocurrency based on the last transaction price of each coin on the blockchain.
An analyst noted that ETH trading beneath this metric generally signals bearish conditions. When the realized price exceeds the current market price, it often functions as resistance, leading to “many holders suddenly finding themselves at a loss,” the analyst remarked.
Additionally, the analyst stated:
“Descending below the realized price often signals a capitulation phase, during which traders lose faith and begin selling in droves.”
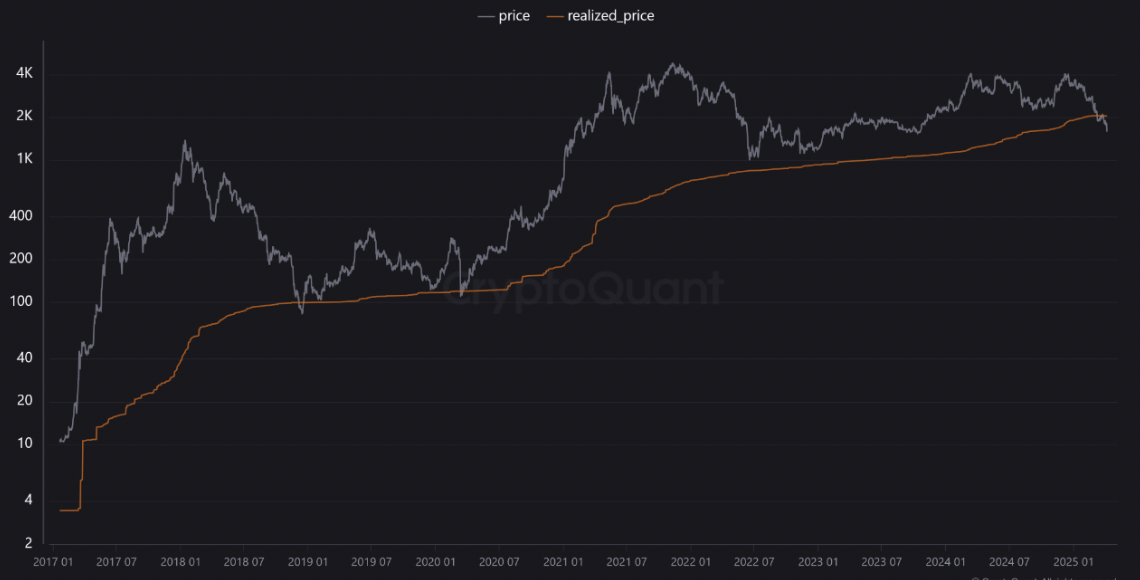
Realized price for accumulation addresses. Source: CryptoQuant
In June 2022, Ether’s realized price fell below its market price, leading to a 51% decline in ETH after the Terra Luna crash. A similar situation unfolded in November 2022 when the metric dropped under the market price, resulting in a 35% decrease following the FTX collapse.
With a parallel situation unfolding now, the current conditions resemble prior bearish continuation phases, placing ETH at risk for a deeper downturn.
Weak Spot Ethereum ETF Flows
Activity in spot Ethereum ETFs continues to decline, registering over $3.3 million in net outflows on April 8. Over the past two weeks, these investment vehicles have experienced $94.1 million in outflows against just $13 million in inflows.
The diminishing interest from investors is troubling, particularly since institutional demand has been a crucial element of Ether’s attraction and contributed to the price increases observed in May 2024, when investors anticipated ETF approvals from the U.S. Securities and Exchange Commission.
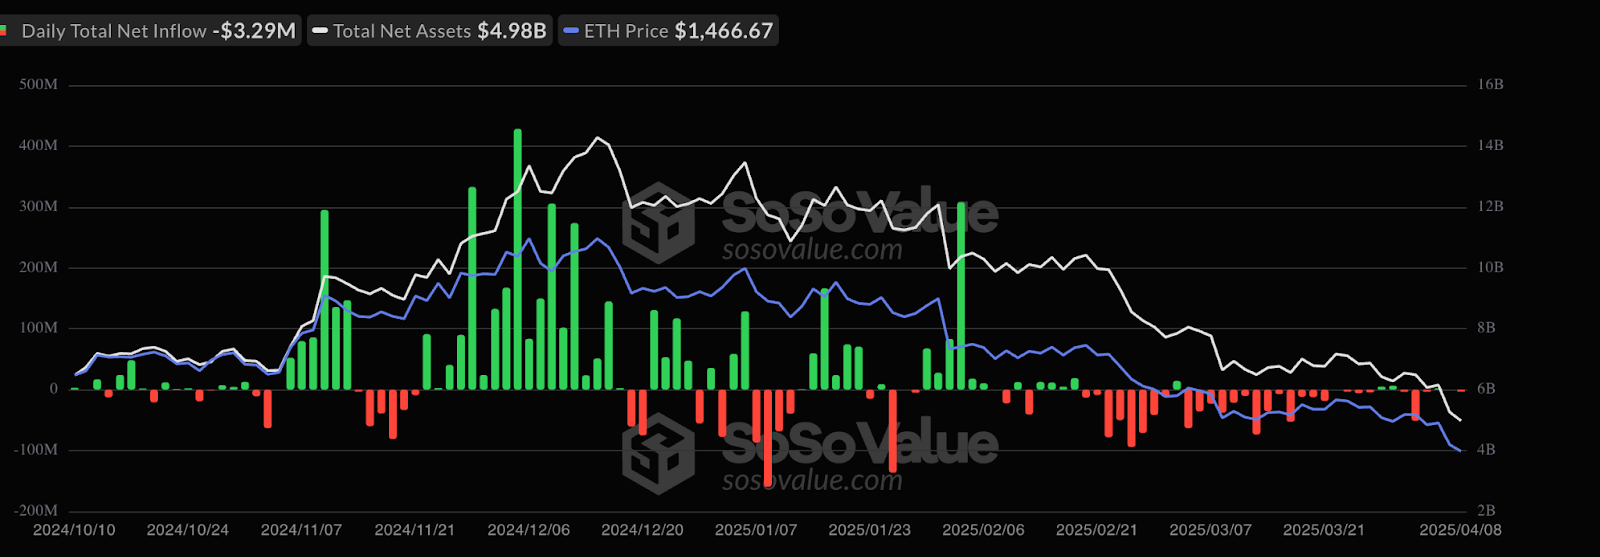
Table of spot Ether ETF flows. Source: Farside Investors
This trend is echoed across all Ethereum-related products, with reports indicating that inflows into Ethereum investment funds correlate with the overall market bearishness, showing outflows of $37.4 million for the week ending April 4.
Low ETH Open Interest and Negative Funding Rates
Another element impacting Ether’s price is the lack of excitement in its derivatives market, as demonstrated by low open interest and negative funding rates.
Open interest (OI)—a measure of all outstanding futures and options contracts—remains low, highlighting decreased trading activity and speculation. Presently at $16.7 billion, OI is down 48% from its peak of $32.3 billion recorded on January 24.
A declining OI indicates diminishing investor confidence, which can further intensify price drops as buying pressure weakens.
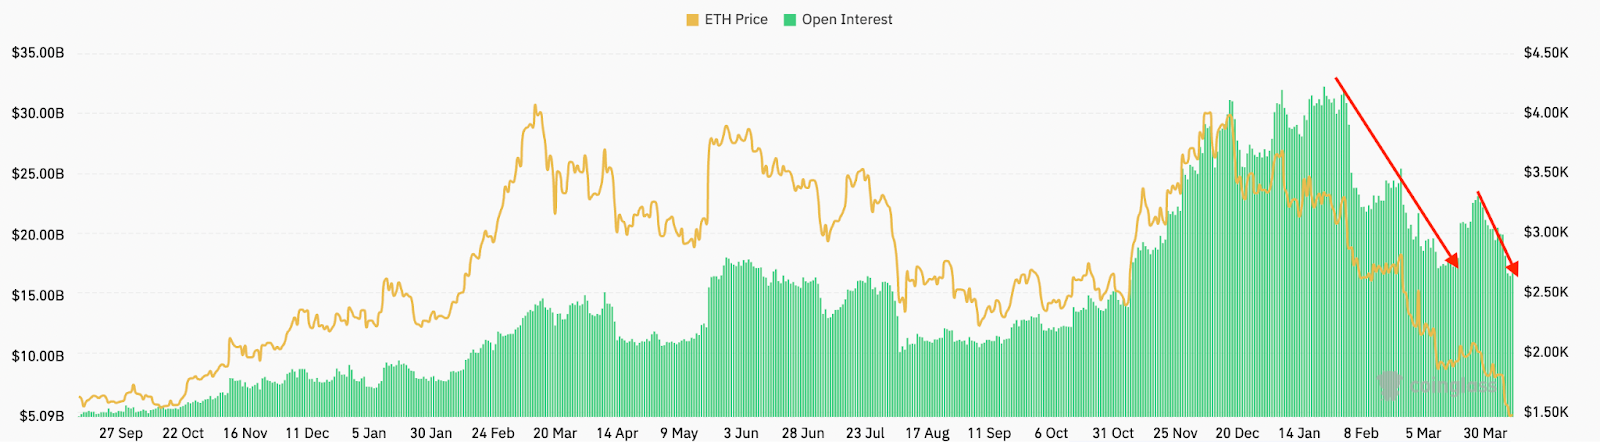
Open interest for ETH across all exchanges. Source: CoinGlass
Compounding this issue are negative funding rates in Ether’s perpetual futures markets, currently below 0%, signaling that bearish sentiment prevails in the market.
Related:Ethereum whale sells ETH after 900 days, missing $27M possible peak profit
When these rates turn negative, it indicates that short sellers (those betting against the price) are compensating long positions, reinforcing the presence of bearish sentiment.
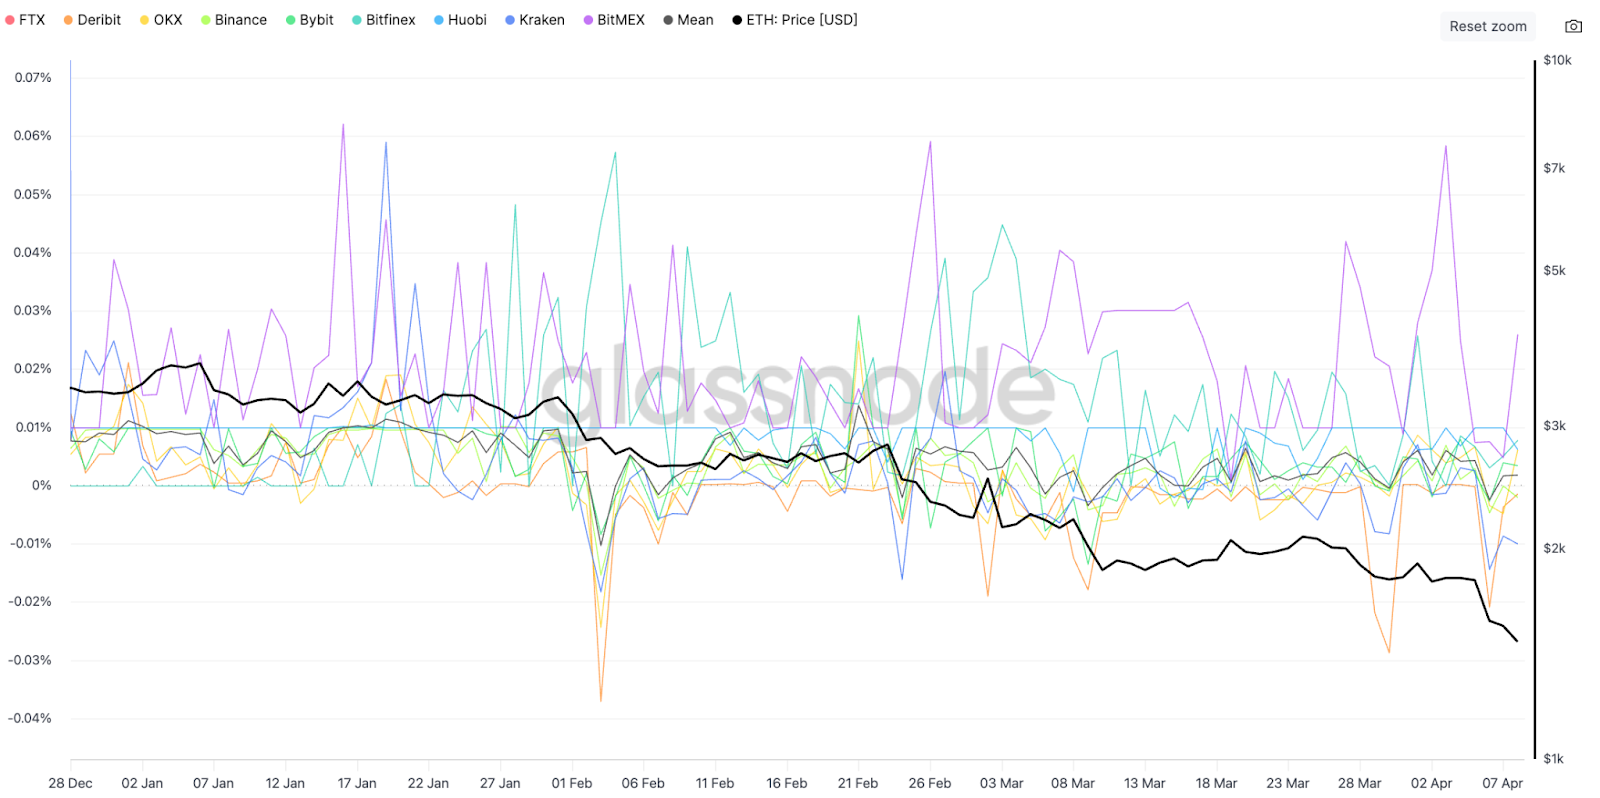
ETH funding rates across all exchanges. Source: Glassnode
Competition from Layer-1 Blockchains
Ethereum’s high gas fees create an opening for competing layer-1 blockchains with a focus on scalability to capture its market share. While some activity has shifted to Ethereum’s layer-2 solutions, many users and developers are opting for other leading layer-1 alternatives such as BNB Chain, Solana, Avalanche, and Tron.
This competition has led to Ethereum’s network activity growth lagging behind that of its rivals.
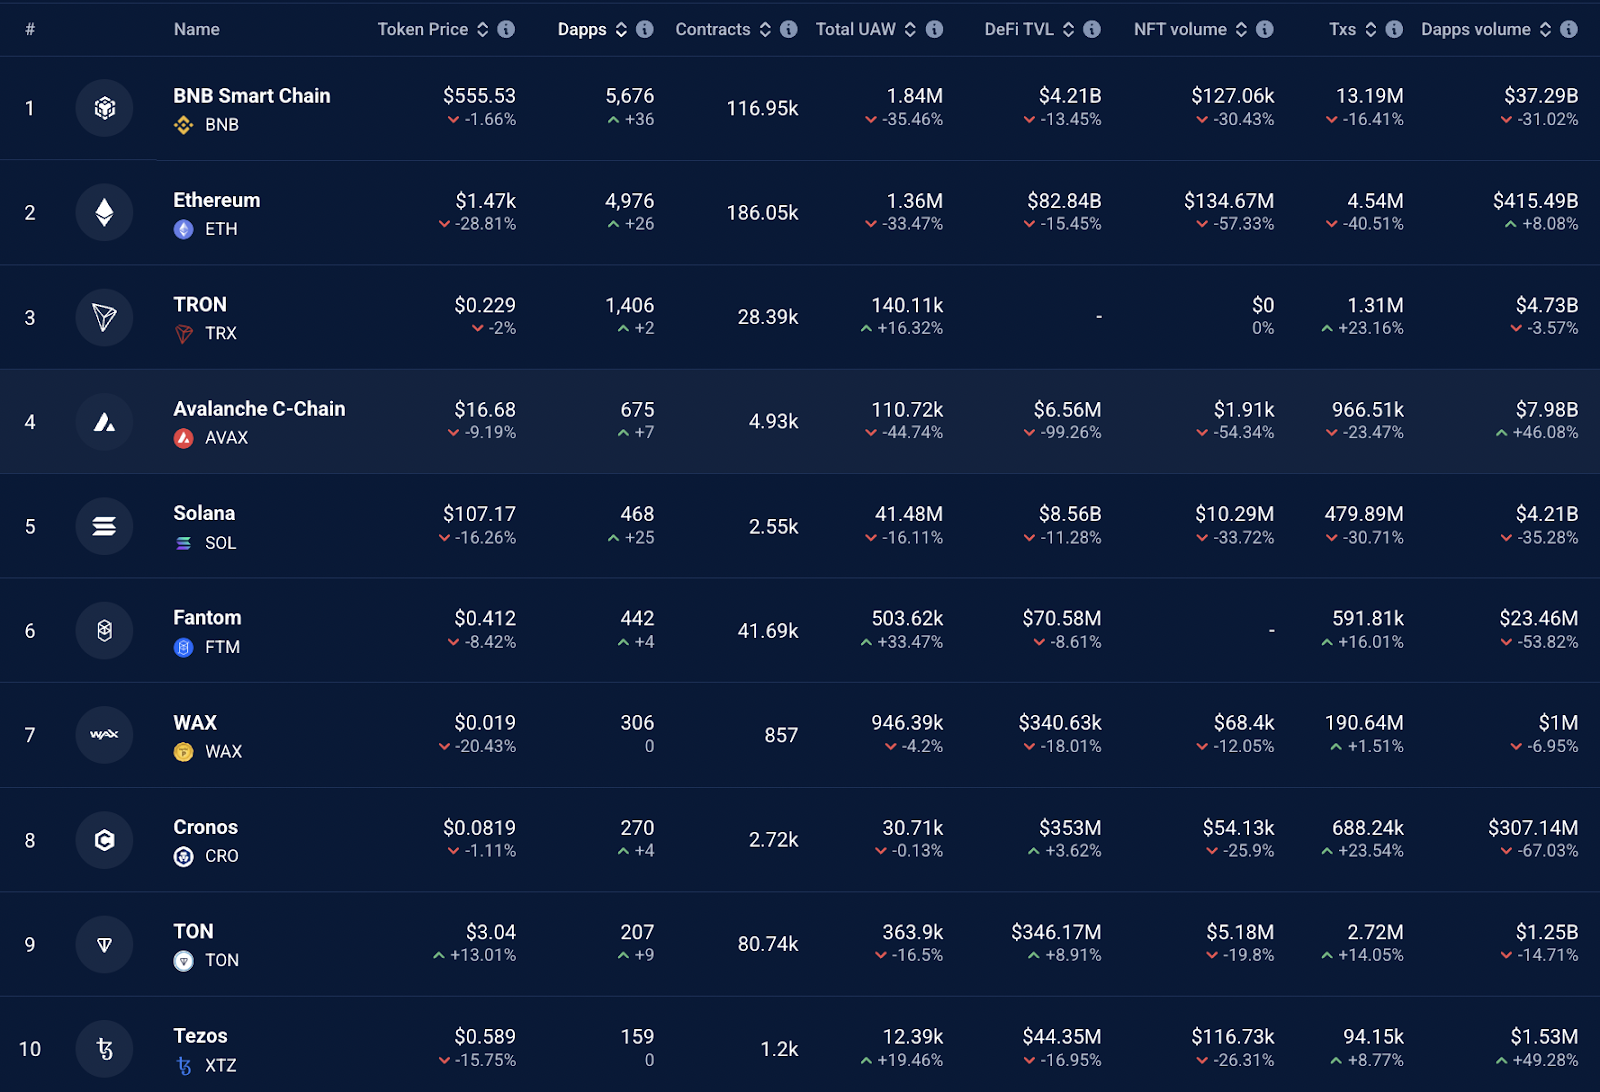
Ranking of top blockchains by 24-hour DApp volume, USD. Source: DappRadar
Unique active wallets (UAW)—addresses interacting with decentralized applications (DApps) on Ethereum—have decreased by over 33% in the last 30 days, compared to a mere 16% drop on Solana and a 16% rise on Tron.
Additionally, the overall transaction count on Ethereum has plummeted by 40.5% during the same period, while transactions on BNB Chain, Solana, and Avalanche fell by 16%, 30%, and 23%, respectively. In contrast, transactions on Tron and Fantom rose by 23% and 16%.
Indicators suggest there might not be an imminent reversal of the factors impacting Ether’s price, such as dwindling network activity and weak demand for spot ETF products.
While this does not definitively imply that Ether’s price will remain on a prolonged downward trajectory, the technical landscape points towards a potential bottom at around $1,000.
This content is for informational purposes only and should not be construed as investment advice. Every investment and trading decision carries risk, and individuals should conduct their own research before proceeding.