- On Thursday, altcoins like Flare, Ondo, and Bittensor experienced significant gains as markets reacted positively to President Trump’s suspension of tariffs.
- Bitcoin’s upward momentum weakens as traders rapidly take profits in response to the unpredictable tariff situation.
- Bittensor displays a falling wedge pattern that suggests a potential 50% breakout.
On Thursday, altcoins staged impressive comebacks following U.S. President Donald Trump’s unexpected reversal on reciprocal tariffs, which came less than a day after they were implemented. Leading the charge, Flare (FLR) surged to $0.0145, marking a 26% increase in the past 24 hours. Ondo and Bittensor (TAO) also saw substantial growth, with gains of 18.37% and 20%, trading at $0.8580 and $236, respectively.
Will altcoins outperform Bitcoin in Q2?
The cryptocurrency landscape has been on a downward trend since the commencement of President Trump’s tariff conflict. As of Monday, Bitcoin (BTC) plummeted to $74,508, its lowest value since November.
Trump’s abrupt reversal on tariffs—enforcing a 90-day halt except for China, which faces a steep 104% tariff—provided a much-needed boost to global markets during the late U.S. session on Wednesday and the Asian session on Thursday.
However, the rally quickly lost steam after Bitcoin reached weekly highs of $83,588. The leading cryptocurrency currently hovers around $82,200 on Thursday, reflecting a 7.4% recovery in the last 24 hours.
The continuation of Bitcoin’s rally towards $90,000 will depend on macroeconomic conditions. While the pause in tariffs across numerous nations is a positive sign, financial analysts caution that the long-term implications for the U.S. economy could be significant.
In the interim, altcoins have shown remarkable recovery, spearheaded by Flare, Ondo, and Bittensor among the top 200 cryptocurrencies. Notably, Bitcoin’s dominance has rebounded to 62%, equating to a market capitalization of $1.63 trillion.
Bitcoin Dominance chart | Source: CoinMarketCap
Flare stands firm at descending channel support
A buy signal from the Moving Average Convergence Divergence (MACD) indicator confirmed the upward movement, as the MACD line (blue) crossed above the signal line (red). The Relative Strength Index (RSI), which had dropped to 25.64 in oversold territory, has climbed back above the mean line, indicating increasing bullish sentiment among traders.
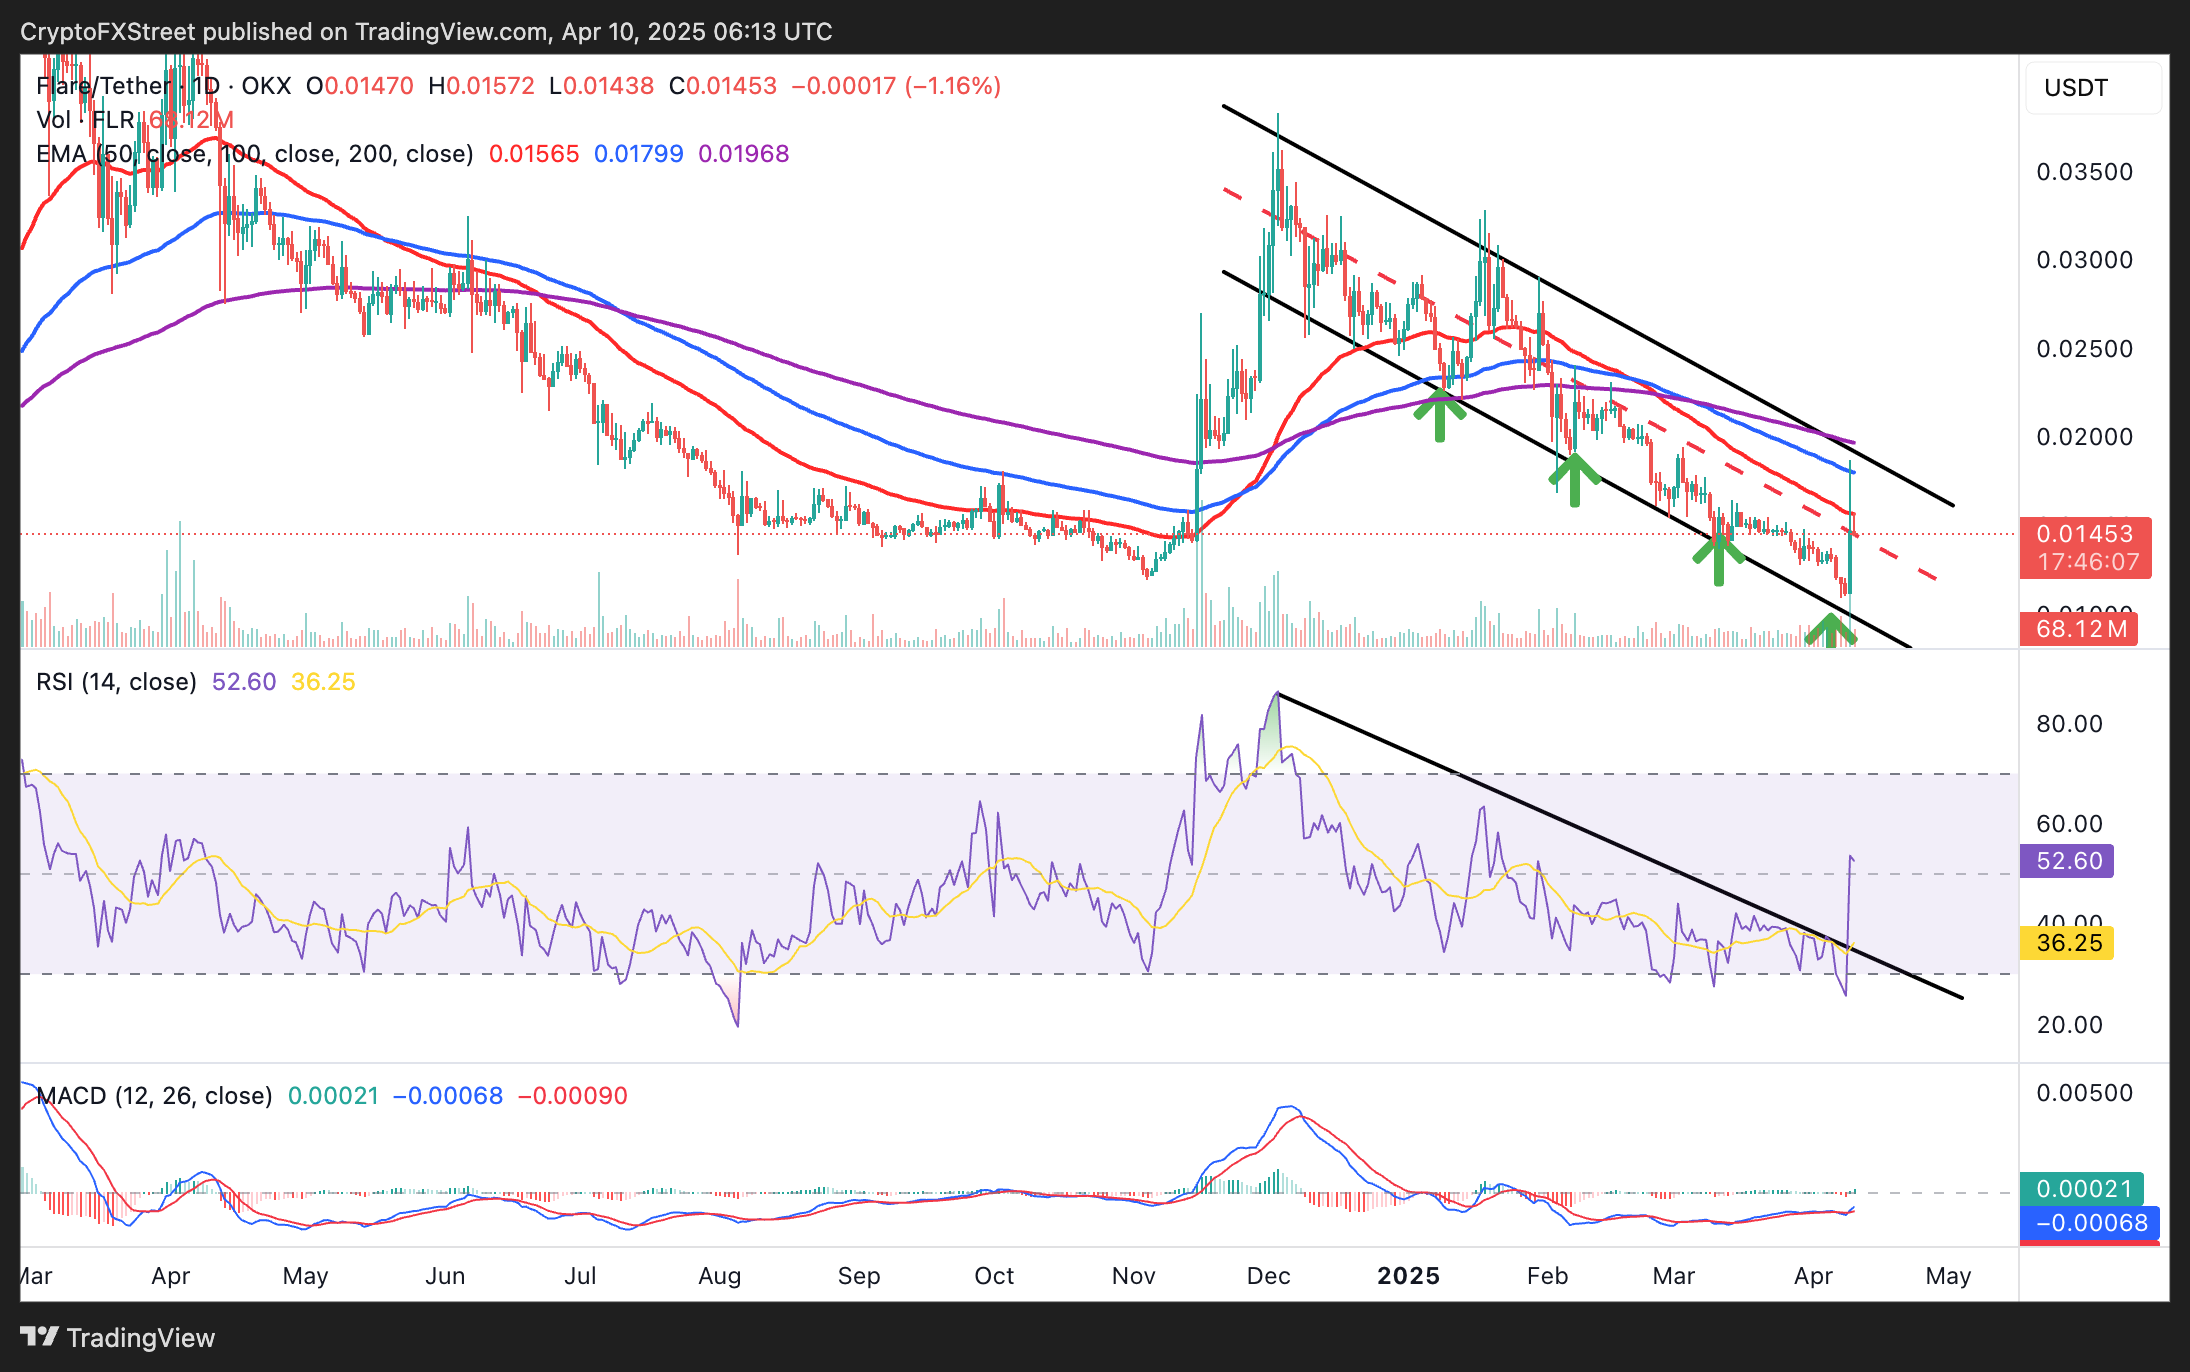
FLR/USD daily chart
Currently, Flare is seeking support at the channel’s midline around $0.0145 after losing the tentative support indicated by the 50-day Exponential Moving Average (EMA) at $0.0156. If bulls can maintain their hold on the asset, a breach of the channel’s resistance could be in the cards.
It’s essential to acknowledge that the downtrend within the descending channel is potent and may not be easily overcome amidst shifting macroeconomic circumstances. Therefore, it’s wise to prepare for various outcomes, including a potential correction to the $0.0108 support level.
Is Ondo’s price nearing a bottom?
@Like many cryptocurrencies, Ondo is experiencing gains, currently priced around $0.8500 on Thursday. The token is positioned above the middle line of the descending channel and is targeting a breakout above the upper resistance near the 50-day EMA at $0.9223.
The chart indicates that the RSI’s breakout above the trendline resistance suggests a developing bullish framework. Consequently, a buy signal from the MACD encourages traders to consider taking more long positions in ONDO.
If Ondo manages to breach the channel resistance, the next point of interest will be $1.4725, a considerable challenge it faced in June 2024.
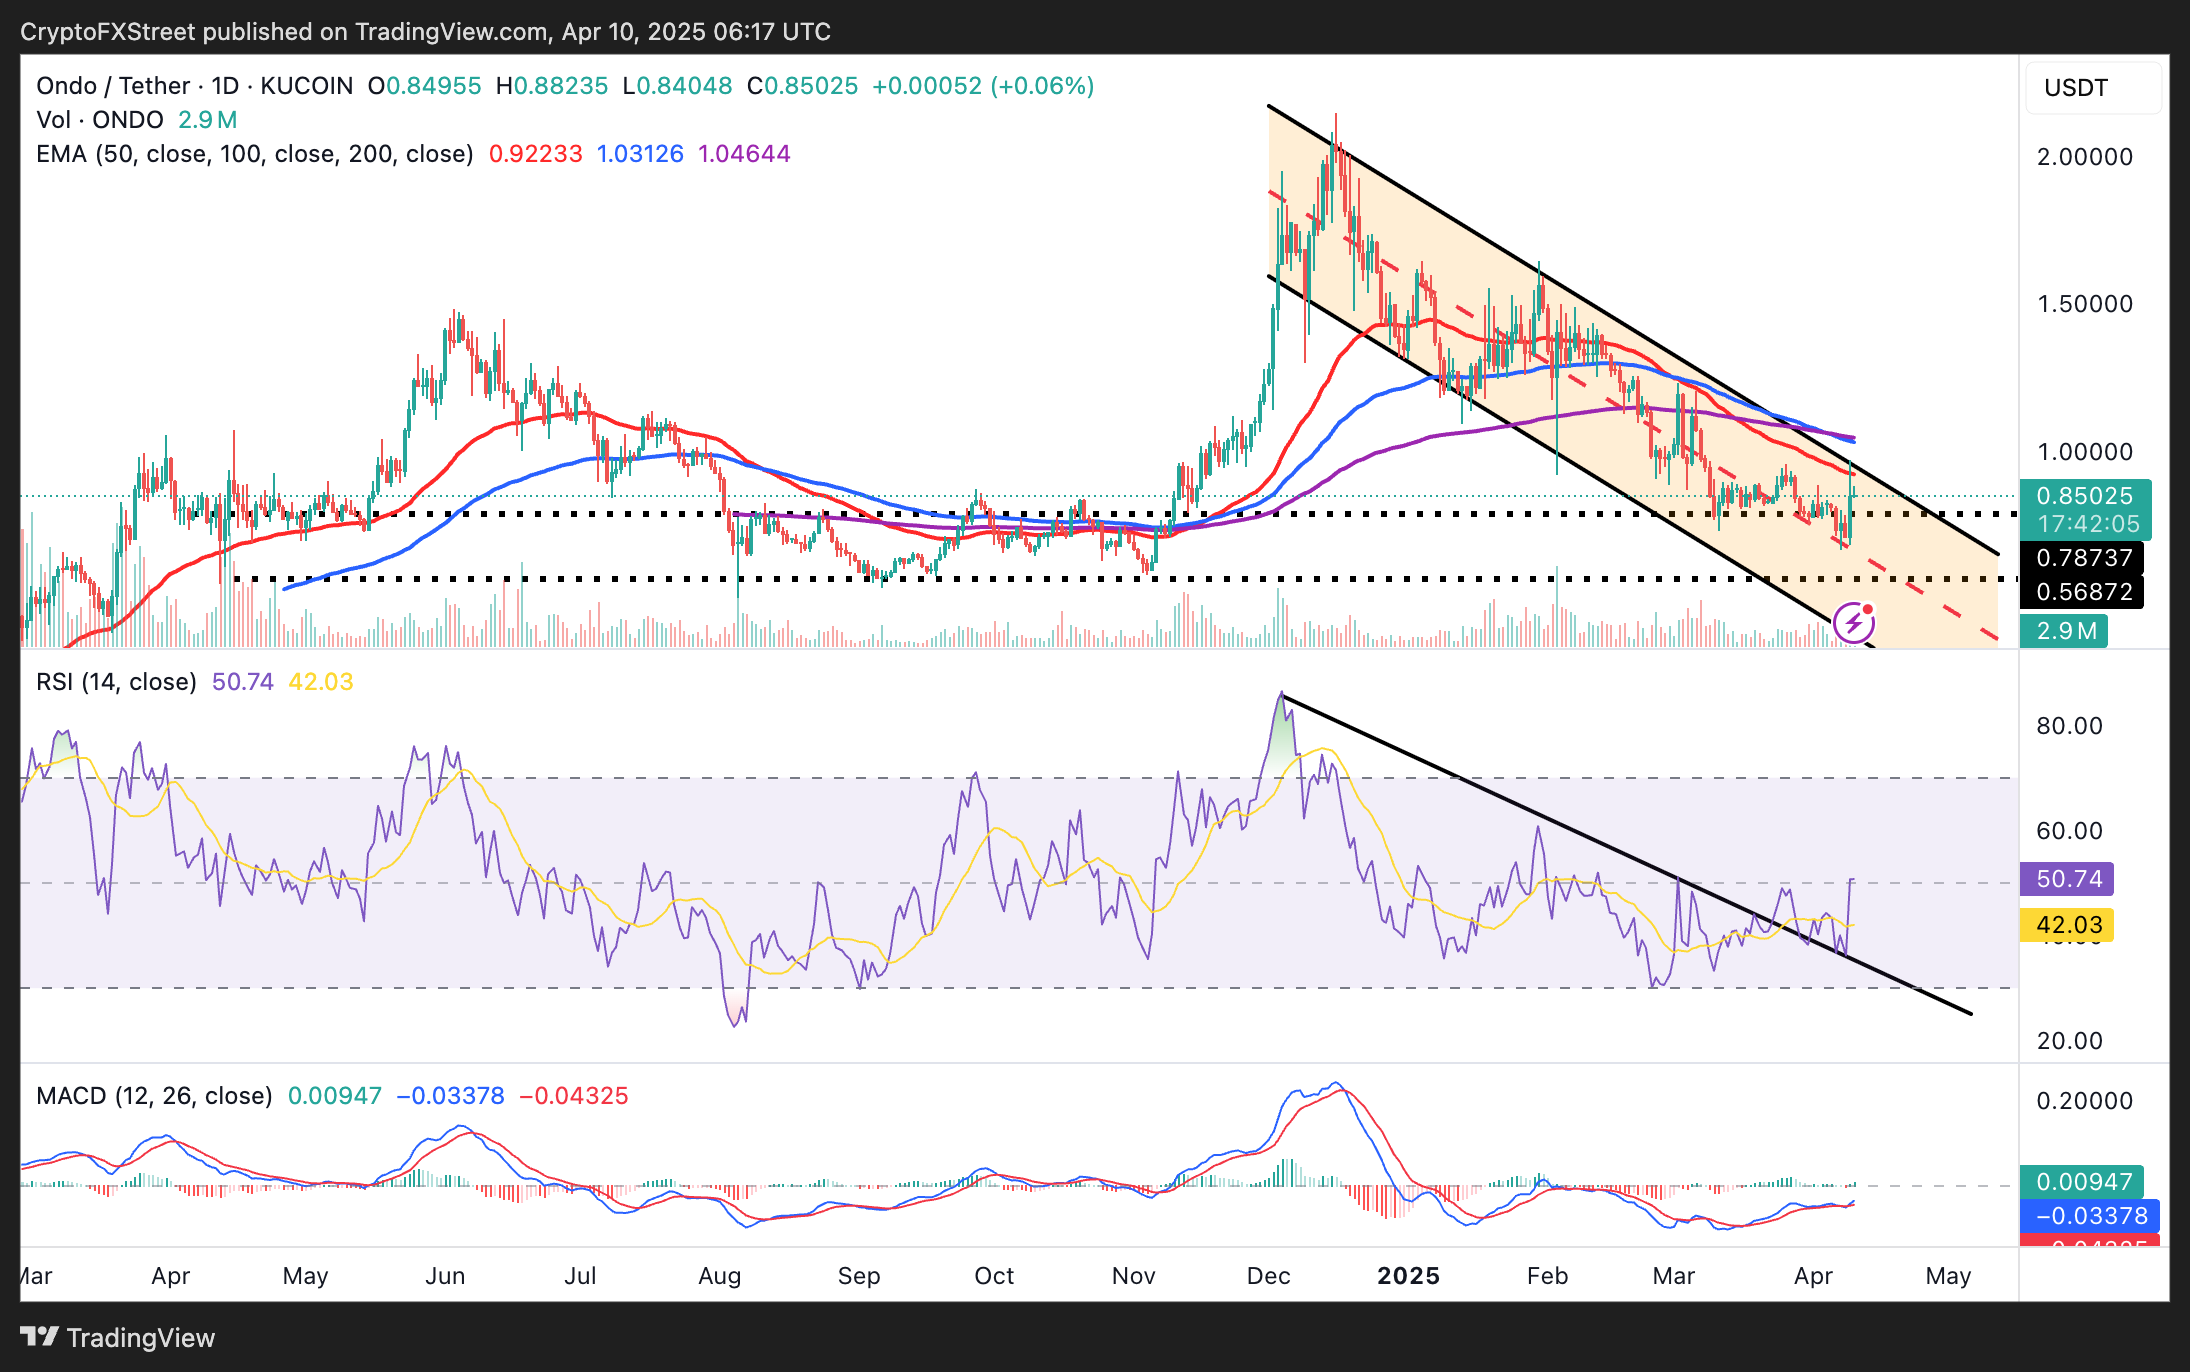
ONDO/USDT daily price chart
Nevertheless, the 50-day EMA along with the channel’s resistance presents significant immediate challenges for Ondo. A failure to overcome this zone could result in a reversal, leading to another wave of selling as traders realize profits. This selling pressure may force Ondo to revisit the channel’s midline or drop to the pattern’s lower support around $0.5687, which was tested in August, September, and November 2024.
Bittensor aims for a breakout in falling wedge pattern
Bittensor, the AI-focused token, held its ground at the $175 support level during Monday’s tariff-induced sell-off. The tariff suspension prompted traders to buy the dip, creating bullish momentum for the token. As a result, TAO surged past $200 to trade at $236 at the time of writing on Thursday.
The bullish sentiment, supported by a MACD buy signal and an upward-rising RSI nearing its neutral zone, indicates that Bittensor is gearing up for a breakout from the falling wedge pattern, potentially driving TAO up by 50% from the breakout point, targeting $393. This target reflects the distance between the wedge’s widest sections.
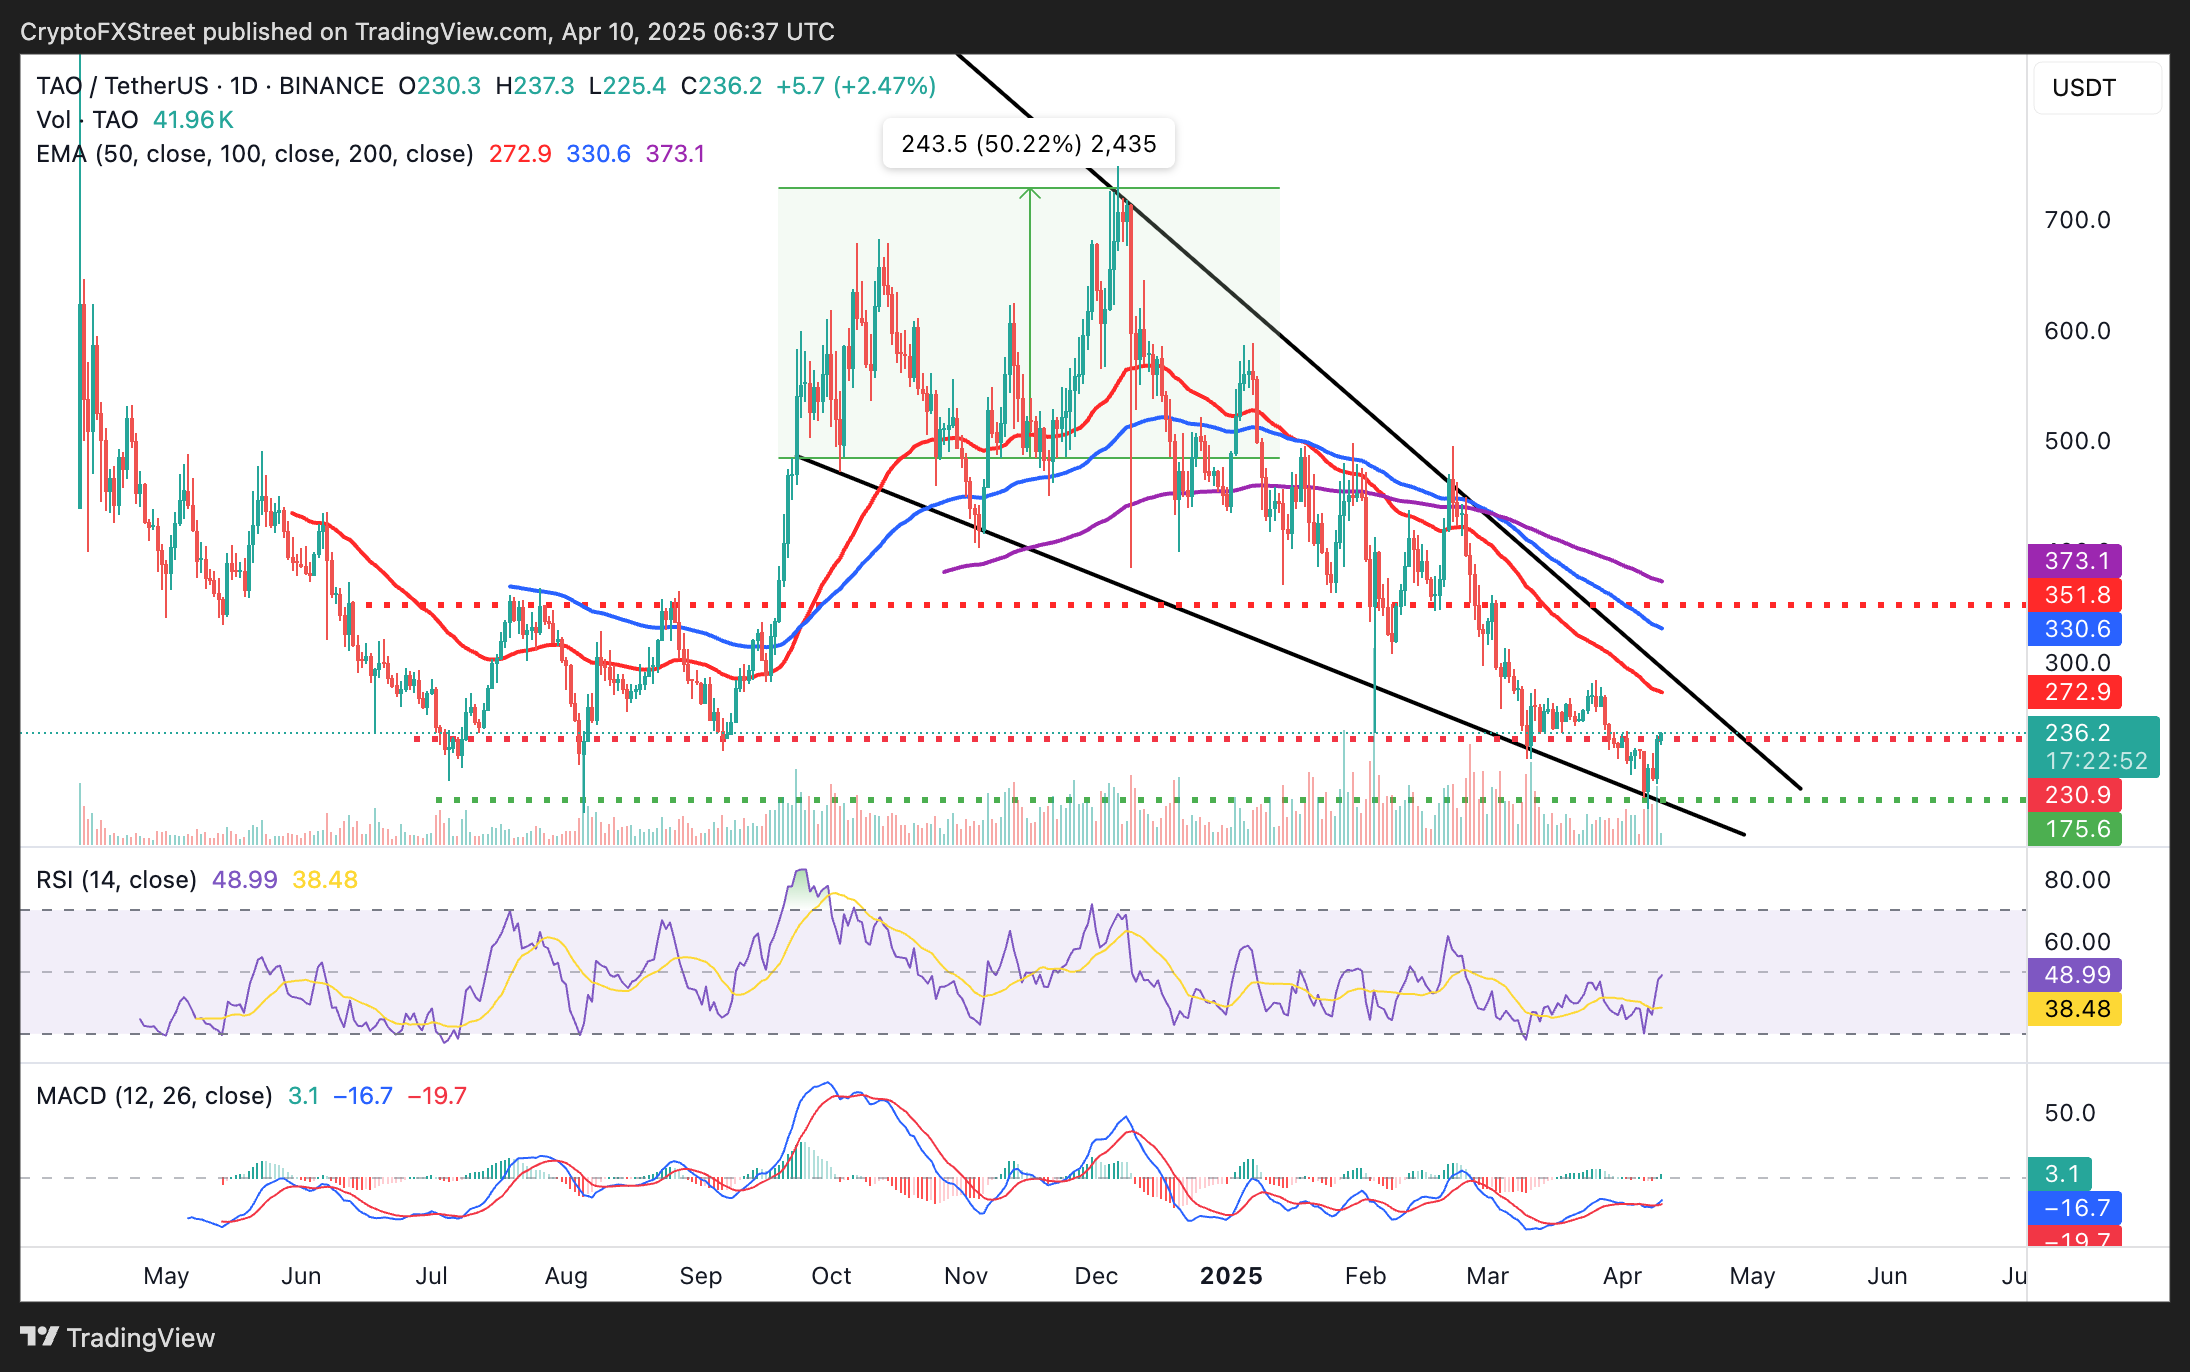
TAO/USDT daily chart
However, the 50-day EMA at $272 could pose a challenge to Bittensor’s bullish outlook, along with the 100-day EMA at $330 and the 200-day EMA at $373. On the downside, it’s crucial to monitor the support level at $175, which was tested previously in July and August 2024.