- Bitcoin’s price exceeded $84,000 on Wednesday, climbing 8% shortly after Trump announced the rollback of tariffs.
- On Monday, BlackRock’s CEO Larry Fink suggested that global markets could fall an additional 20% if new tariffs are implemented, labeling it a “buying opportunity.”
- Technical signals indicate that BTC might encounter selling pressure around $85,000 if traders decide to take early profits.
Bitcoin jumped past $83,500, surging 12% after Trump reversed global tariffs. This market resurgence follows CEO Larry Fink’s comments about a potential buying opportunity made on Monday.
Trump’s tariff rollback led to a Bitcoin surge toward $84K
On Wednesday, Bitcoin (BTC) experienced a more than 8% jump, reclaiming the $84,000 threshold, which represents its largest intraday gain since mid-March.
This upward movement was sparked by former President Donald Trump’s announcement of a 90-day halt on anticipated global tariffs.
The new measures implement a flat 10% tariff on imports from all U.S. trading partners, excluding China, alleviating concerns about a larger trade conflict.
Bitcoin price response following Trump’s tariff rollback, April 9 2025.
As illustrated above, Bitcoin’s price surged 13% from its lowest intraday level of $74,700, peaking at $83,600. Altcoins mirrored this movement, with Ethereum, XRP, and Dogecoin all recording double-digit intraday increases at the time of reporting.
Fink’s predictions come true as markets rebound sharply
During a session at the Economic Club of New York on Monday, BlackRock’s billionaire CEO Larry Fink cautioned that the proposed tariffs might lead to a 20% decline in global markets. Instead of viewing this as negative, Fink portrayed it as a potential “buying opportunity” for discerning investors.
“I consider it more of a buying opportunity than a selling opportunity, but that doesn’t mean we can’t face further declines,” Larry Fink stated.
In hindsight, Trump’s unexpected policy shift on Wednesday seems to corroborate that forecast.
Bitcoin Price Outlook: Focus shifts to $88,800 resistance as $100K target looms
With inflation reports from both the U.S. and China’s Labor Bureaus set to be released on Thursday, many investors are adopting a wait-and-see stance. This could explain why the BTC price has stalled just below the $83,600 mark following the initial wave of buy orders triggered by Trump’s tariff announcement.
As the markets anticipate macroeconomic insights from the world’s two largest economies, BTC price is likely to experience increased volatility in the next 18 hours.
Amid this uncertainty, cautious long-term investors may be reluctant to commit to substantial positions, creating opportunities for swing traders and market makers to profit from this indecision.
In an ideal scenario, if the forthcoming inflation data from both the U.S. and China are favorable and interpreted positively, many traders might take this as the final confirmation of Fink’s “buying opportunity” forecast.
Nevertheless, even if this optimistic scenario unfolds, technical indicators suggest that the path to a Bitcoin price rebound toward the $100,000 mark remains quite challenging.
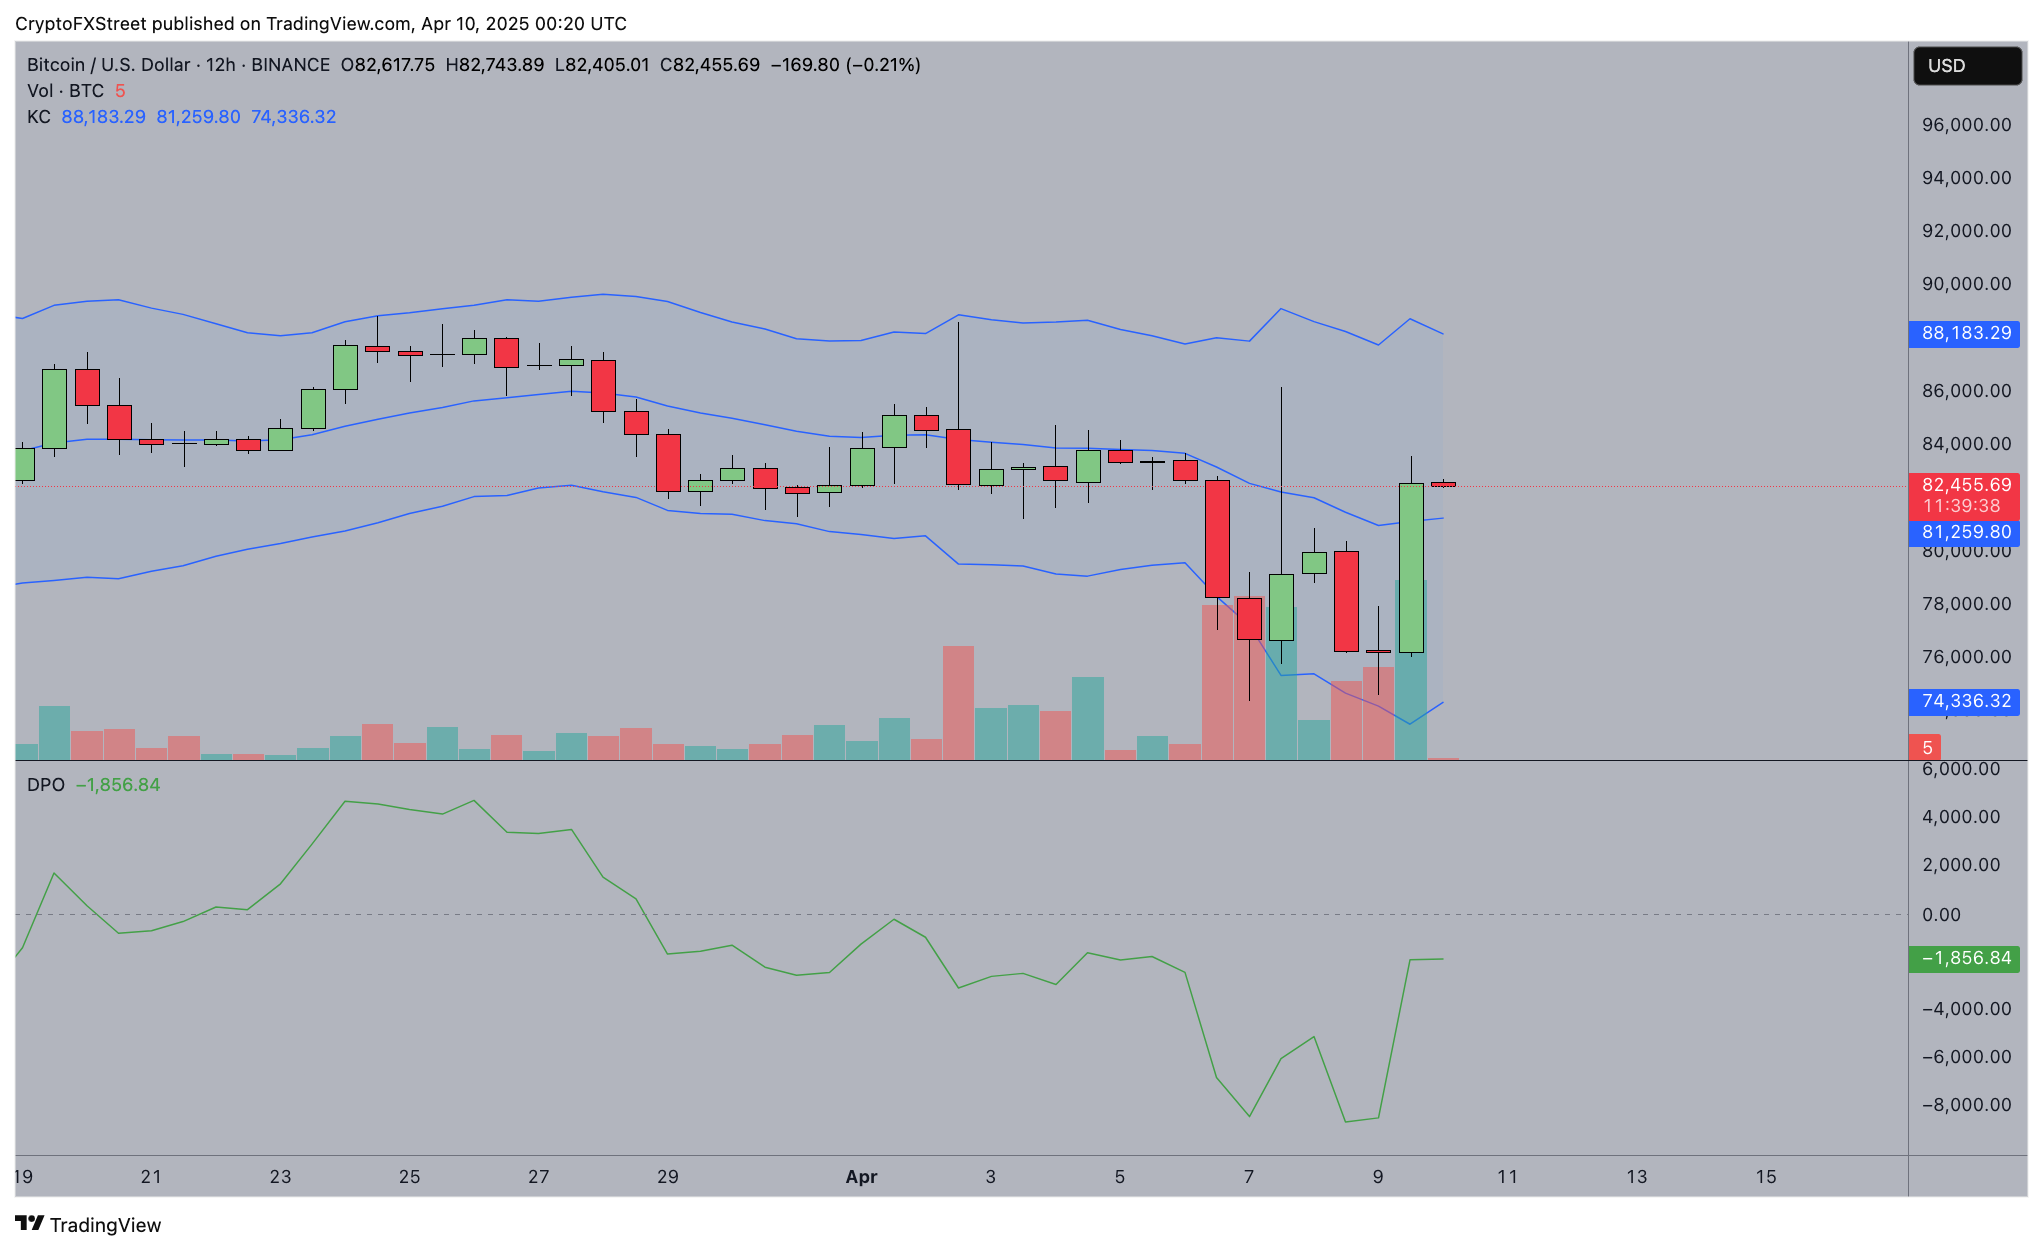
Bitcoin price forecast | BTCUSDT
The chart above indicates that the upper Keltner channel band on the BTCUSDT 12-hour chart reveals significant resistance at $88,183. This corresponds with the peak price recorded on April 2, when Trump initially announced the tariffs.
Generally, when an asset enters a rebound phase, traders who purchased at the start of the most recent downturn are likely to sell once they break even.
This suggests that Bitcoin’s current rebound could encounter considerable resistance as it approaches the prior sell-off point at $88,100, making the $100,000 milestone a distant prospect for the short term.
BTC risks to monitor if U.S. and China inflation reports disappoint
If inflation reports from the U.S. or China turn out stronger than expected, markets may adjust for more aggressive monetary tightening—prompting investors to adopt a risk-averse stance. In such a scenario, Bitcoin could swiftly retrace its recent gains.
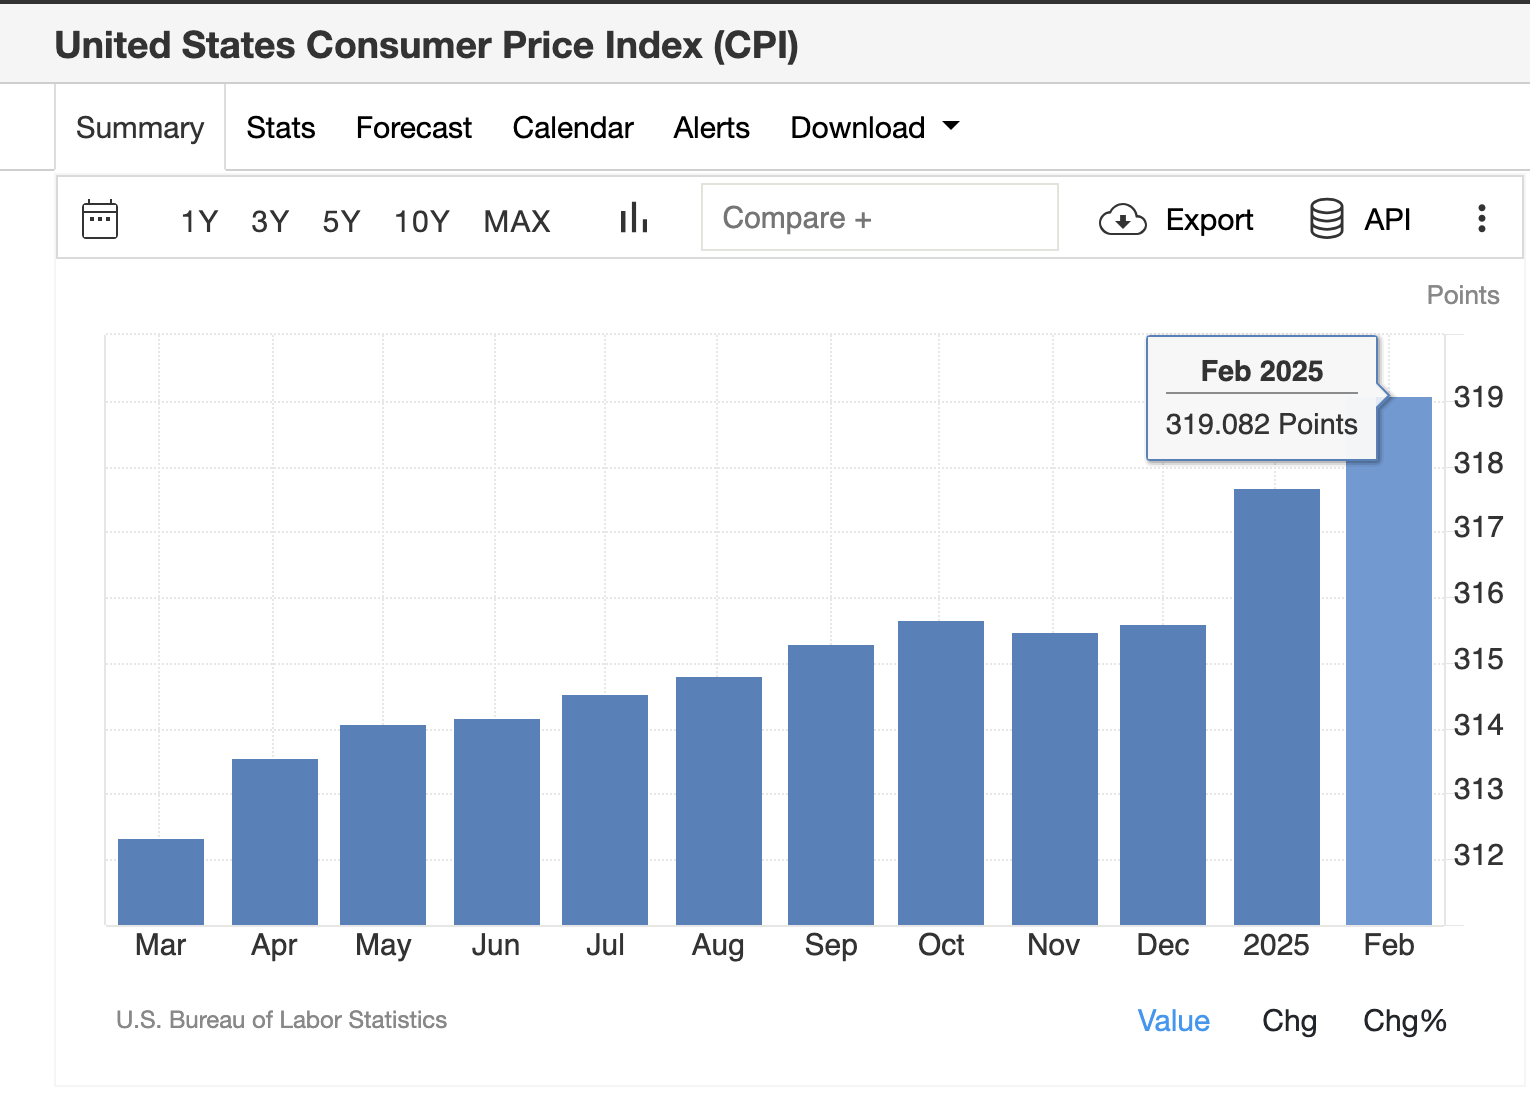
US Consumer Price Index (CPI) in February 2025 increased by 0.44% to 319.08 points.
The lower Bollinger Band, around $73,500, represents a potential support zone if bearish sentiment returns. This level aligns with a liquidity cluster formed during last week’s period of consolidation, making it a likely target for any corrective movements.
Moreover, the Detrended Price Oscillator (DPO) remains significantly negative at -1,888, indicating that despite the recent rally, the underlying momentum has yet to fully confirm a sustainable upward trend.
A drop below $80,000—especially on high volume—could trigger further declines and potentially reset BTC’s short-term trajectory.
In summary, while there is optimism, particularly if inflation data supports Fink’s thesis, Bitcoin must decisively surpass the $88,800 resistance for the $100,000 target to become more than just psychological. Conversely, failure to maintain above $80,000 could expose BTC to a sharp decline toward $73,500.