The price of Bitcoin (BTC) has surged by more than 11% since its low of $74,400 on April 7. Analysts are optimistic, citing onchain metrics and technical indicators that suggest a continued recovery.
Respected analyst AlphaBTC indicates that Bitcoin could maintain this upward trend if it stays above the $81,500 mark.
After retesting key levels from the previous week and addressing some inefficiencies left by prior market movements, Bitcoin successfully regained the important psychological threshold of $80,000, according to an April 10 update from AlphaBTC.
“I’m eager to see it back above 81.5k soon; that might lead to a more sustained rally as shorts are pressured.”
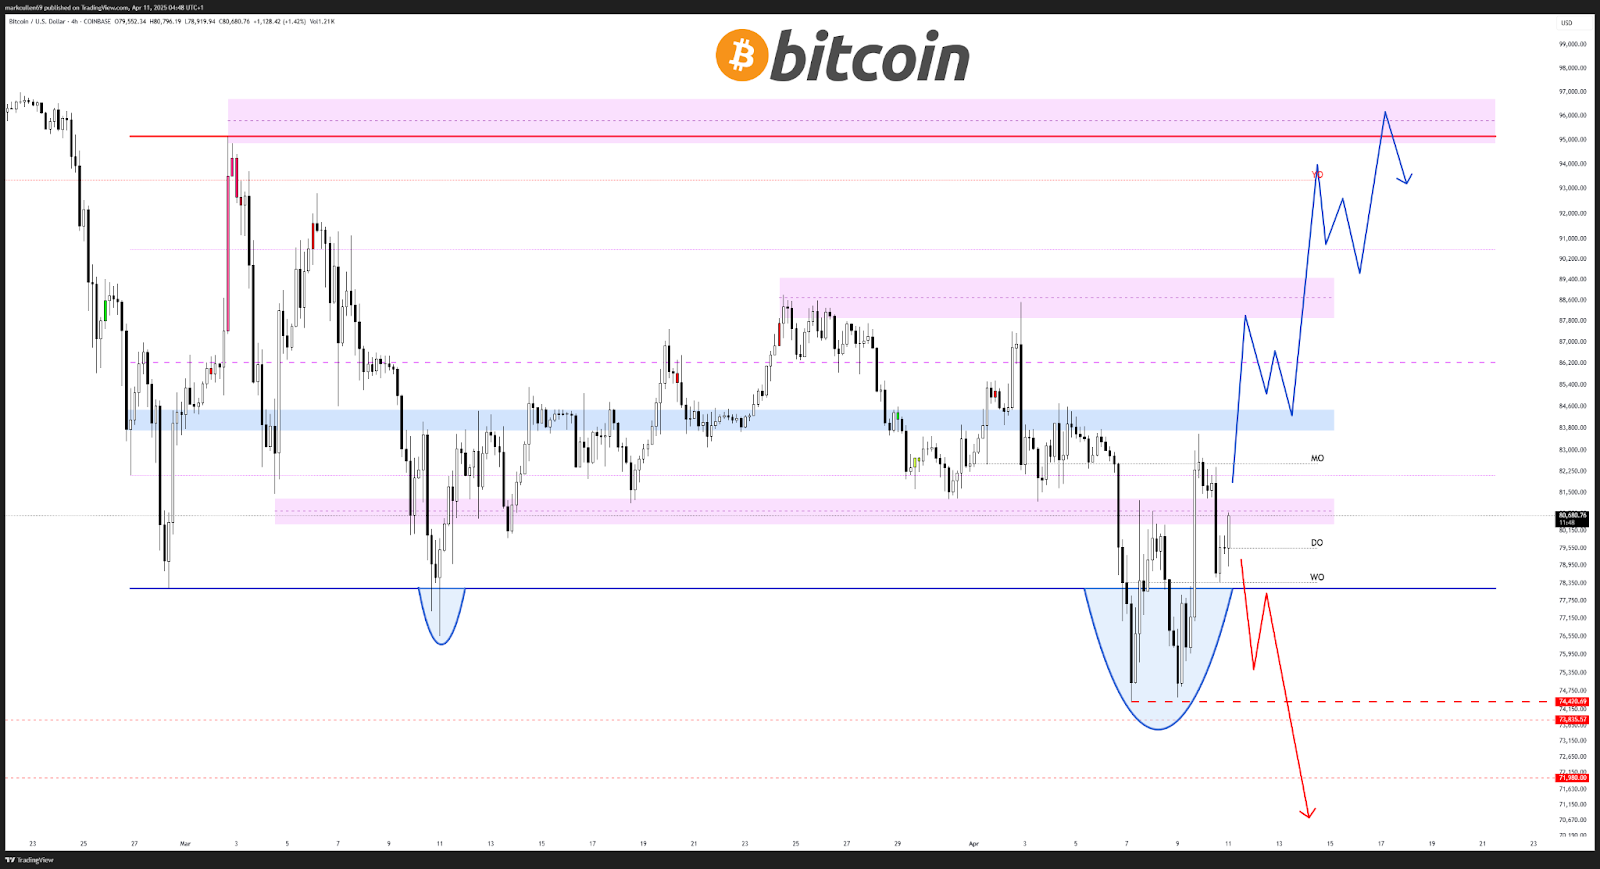
BTC/USD four-hour chart.
Analyst Rekt Capital echoed these thoughts, stating that Bitcoin must close the week above $80,500 to enhance the likelihood of recovery.
“Bitcoin has recently slipped below the critical red Weekly level, confirming that BTC is still not entirely in the clear,” Rekt Capital noted in an April post.
“$BTC needs to remain above the red line until the Weekly Close for the price to re-establish this Weekly level as support.”
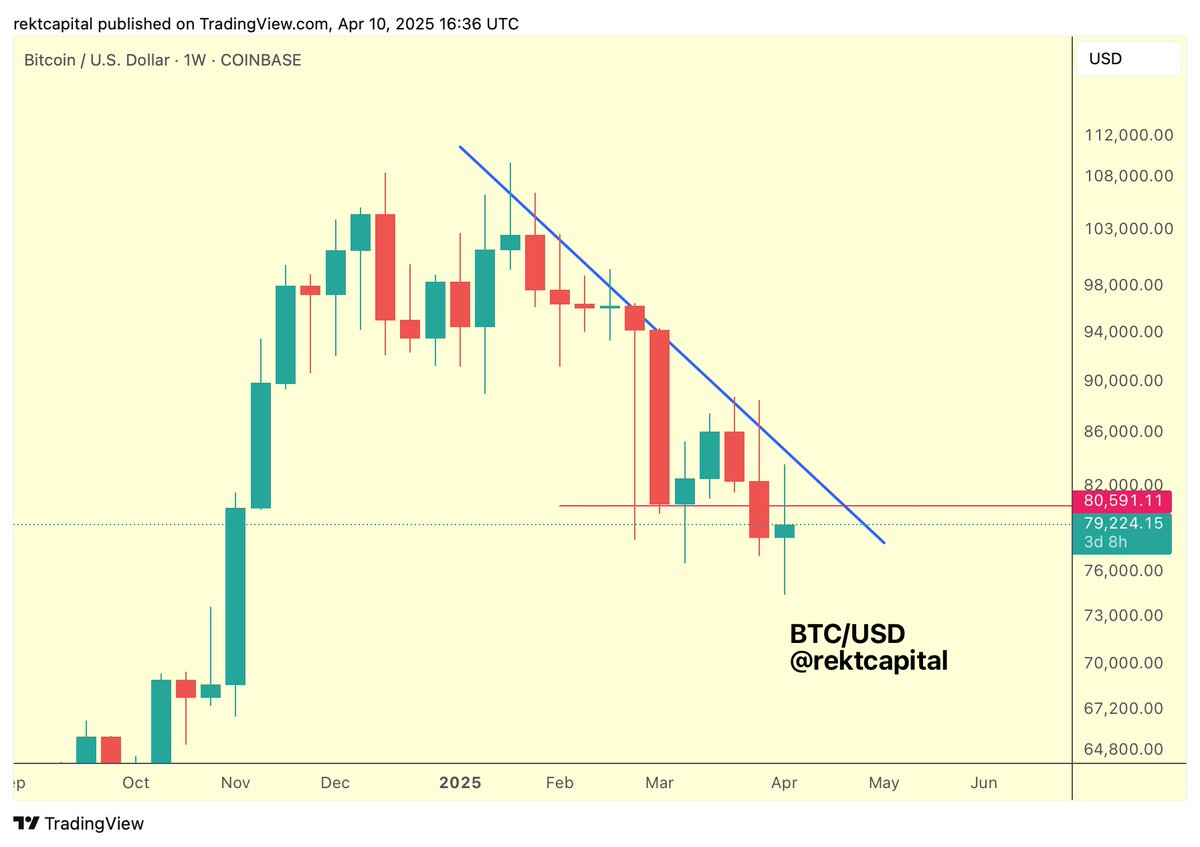
BTC/USD weekly chart.
Potential Recovery Driven by “Seller Exhaustion”
Investors in Bitcoin may be experiencing a state of “near-term seller exhaustion,” as indicated by a decline in realized losses, based on onchain insights. Market intelligence provider Glassnode observed that the extent of losses realized during recent downturns has diminished with each successive price drop.
“Bear markets often begin with significant fear and considerable losses,” Glassnode stated in its latest report.
“This may suggest a form of near-term seller exhaustion is beginning to take place within this price range.”

Bitcoin: 6-hour rolling losses.
Related: Is Bitcoin price about to experience another crash?
Bollinger Bands and W Formation Suggest Potential New Highs
Following a five-month low of $74,400 on April 9, Bitcoin retested the lower boundary of the Bollinger Bands indicator, which has provided support over the past five weeks, as demonstrated by data available on TradingView.
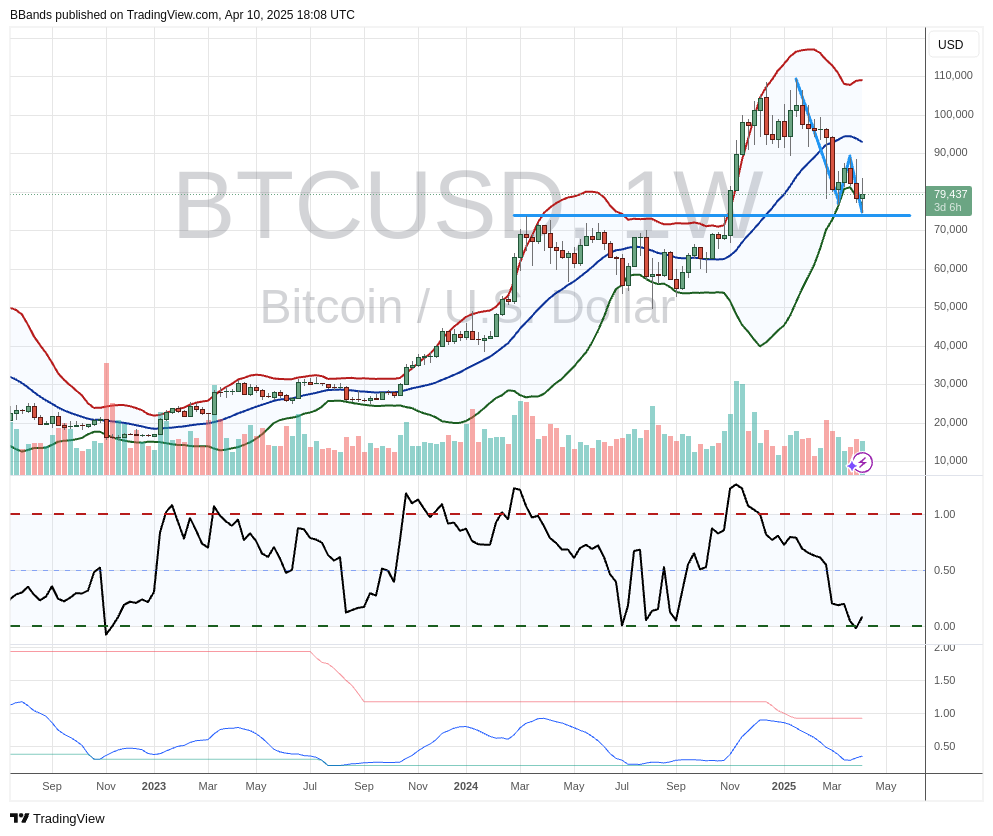
BTC/USD weekly chart featuring Bollinger Bands.
This development is promising, according to John Bollinger, the creator of the Bollinger Bands volatility indicator. This tool employs standard deviation around a simple moving average to assess expected price ranges and volatility.
Bollinger suggested that Bitcoin may be forming the second low of a W-shaped pattern, which typically features a double bottom followed by a breakout to the upside, on the weekly chart.
“A classic Bollinger Band W bottom is setting up in $BTCUSD,” he remarked alongside a chart, adding that the formation “still needs confirmation.”
In this scenario, Bitcoin’s drop to $76,600 on March 11 constitutes the first bottom, while the recent dip to $74,400 serves as the second.
If this pattern is confirmed, the price of BTC could first target the neckline of the W formation at $88,800, followed by a potential rise to the target of the prevailing pattern at $106,000.
This article does not offer investment advice or recommendations. All investments and trading activities involve risks, and readers should perform their own due diligence before making decisions.