- Prices for Curve DAO and Aethir have surged past their descending trendlines, signaling a potential upward movement.
- The momentum indicators for CRV and ATH reflect a positive outlook, indicating a possible rally on the horizon.
- On-chain analytics depict a bullish scenario as CRV’s open interest and ATH’s daily active addresses are on the rise.
Curve DAO (CRV) and Aethir (ATH) prices have moved above their descending trendlines, indicating a possible upward trend. As of Friday, CRV has increased by 5.7% and is trading at approximately $0.59, while ATH has stabilized its recent gains, hovering around $0.031. The momentum indicators of both cryptocurrencies showcase a favorable outlook, pointing towards a potential rally. Additionally, the on-chain data reinforces a bullish sentiment as CRV’s open interest and the daily active addresses of ATH are both increasing.
Bulls in Curve DAO aim for 17% gains
The price of Curve DAO has ascended above a descending trendline (traced by connecting several highs since early December) and has closed above its 200-day Exponential Moving Average (EMA) at $0.54 on Thursday. As of Friday, it has risen by 5.7% to trade around $0.59.
Should CRV continue its upward trajectory, it could potentially extend the rally by 17% from current levels, aiming to re-test its daily resistance at $0.69. A successful close above that point could yield an additional gain of 20%, targeting the high of $0.83 from January 31.
The Relative Strength Index (RSI) on the daily chart stands at 61, indicating bullish momentum. Moreover, the Moving Average Convergence Divergence (MACD) indicator signaled a bullish crossover on Thursday, suggesting a continuation of the upward movement.
CRV/USDT daily chart
CRV’s Open Interest (OI) further bolsters the optimistic outlook. Data shows that the futures’ OI for CRV at exchanges increased to $167.64 million on Friday, up from $102.04 million on Monday, marking the highest level since February 2. An increasing OI indicates fresh or additional capital entering the market, signaling a potential rally for Curve DAO’s price.
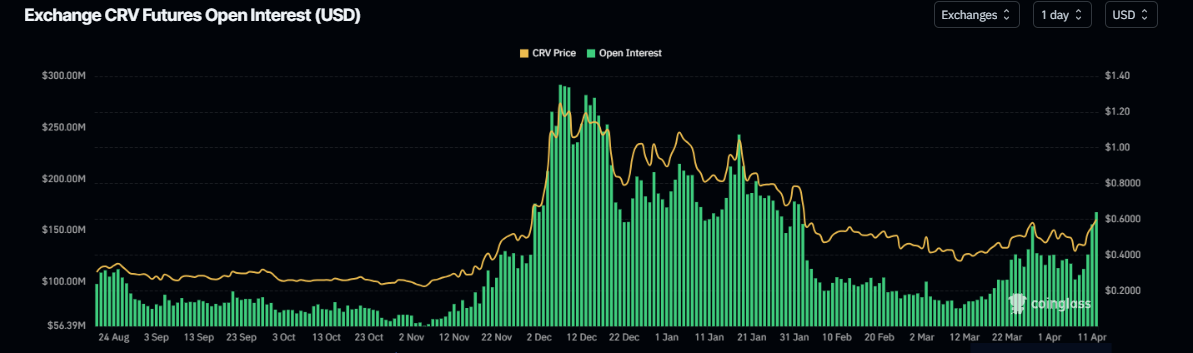
CRV Open Interest chart.
Aethir may experience a rally after surpassing a descending trendline
If the $0.030 daily support level holds, ATH could extend its rally by 16% from current levels, aiming to retest its high of $0.036 from March 26. A successful close above that could enable an additional gain of 11%, targeting a further daily resistance at $0.040.
The RSI on the daily chart stabilizes around the neutral level of 50, indicating uncertainty among traders. The RSI needs to rise above the neutral level of 50 to maintain bullish momentum.
On Thursday, the MACD indicator exhibited a bullish crossover, providing a buy signal and hinting at a continuation of the upward trend.
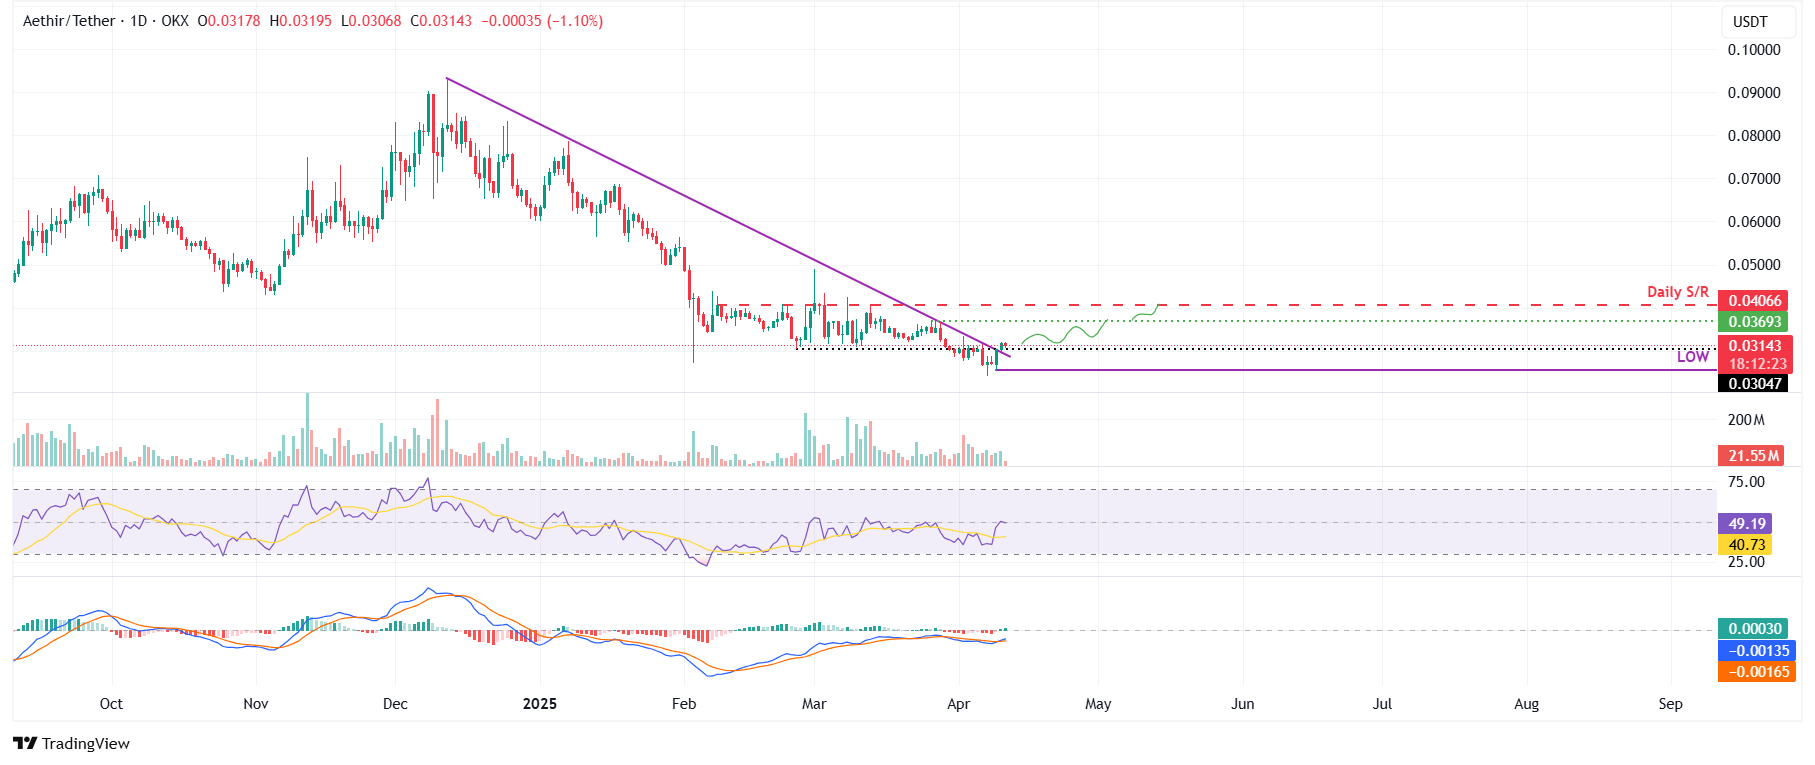
ATH/USDT daily chart
The Daily Active Addresses index offers additional validation of the bullish perspective noted in the technical analysis. An uptick in this metric indicates greater blockchain engagement, whereas a decline suggests diminished demand for the network.
In the case of ATH, Daily Active Addresses have surged by 39% over the past four days. This increase represents the highest level since late March and signals a growing demand for Aethir’s blockchain, which could enhance the potential for a price rally.
 [11-1744355317347.25.15, 11 Apr, 2025].png)
ATH’s active addresses chart.