Spot Ethereum exchange-traded funds have been experiencing significant asset withdrawals as concerns over a possible US recession mount and its market price deteriorates.
Recent data indicates that spot Ethereum (ETH) ETFs have faced asset reductions for seven consecutive weeks, culminating in net outflows of $82.4 million last week, which brings the overall inflows to $2.2 billion.
Currently, all Ethereum ETFs collectively hold only $5.25 billion in assets, with leading products like BlackRock’s ETHA and Grayscale’s ETHE each managing $1.85 billion. Following closely is Grayscale’s mini fund ETH with $711 million, while Fidelity’s FETH holds $580 million.
In contrast, spot Bitcoin ETFs are faring better, boasting cumulative outflows exceeding $35 billion and total assets amounting to $93 billion.
The decline in assets for Ethereum ETFs can be attributed to its performance; the price of ETH has plummeted nearly 62% from its peak in November of last year, now resting at approximately $1,655.
Unlike Bitcoin (BTC), which reached a new all-time high this year, Ethereum has remained significantly below its peak of $4,872. To illustrate, an investment of $1,000 in Ethereum on the same day in 2022 would now only yield $745, whereas an equivalent investment in Bitcoin would have grown to $1,400.
Ethereum has encountered multiple hurdles over time, with fierce competition from layer-1 and layer-2 networks posing the most significant challenge. Leading competitors include Solana (SOL), Base, Tron (TRX), and Arbitrum (ARB).
This competitive landscape has diminished Ethereum’s status as the highest-grossing blockchain in the industry. Recent data indicates that other popular chains and applications such as Uniswap, Jito, and Solana have outperformed it this year.
Ethereum Price Technical Analysis
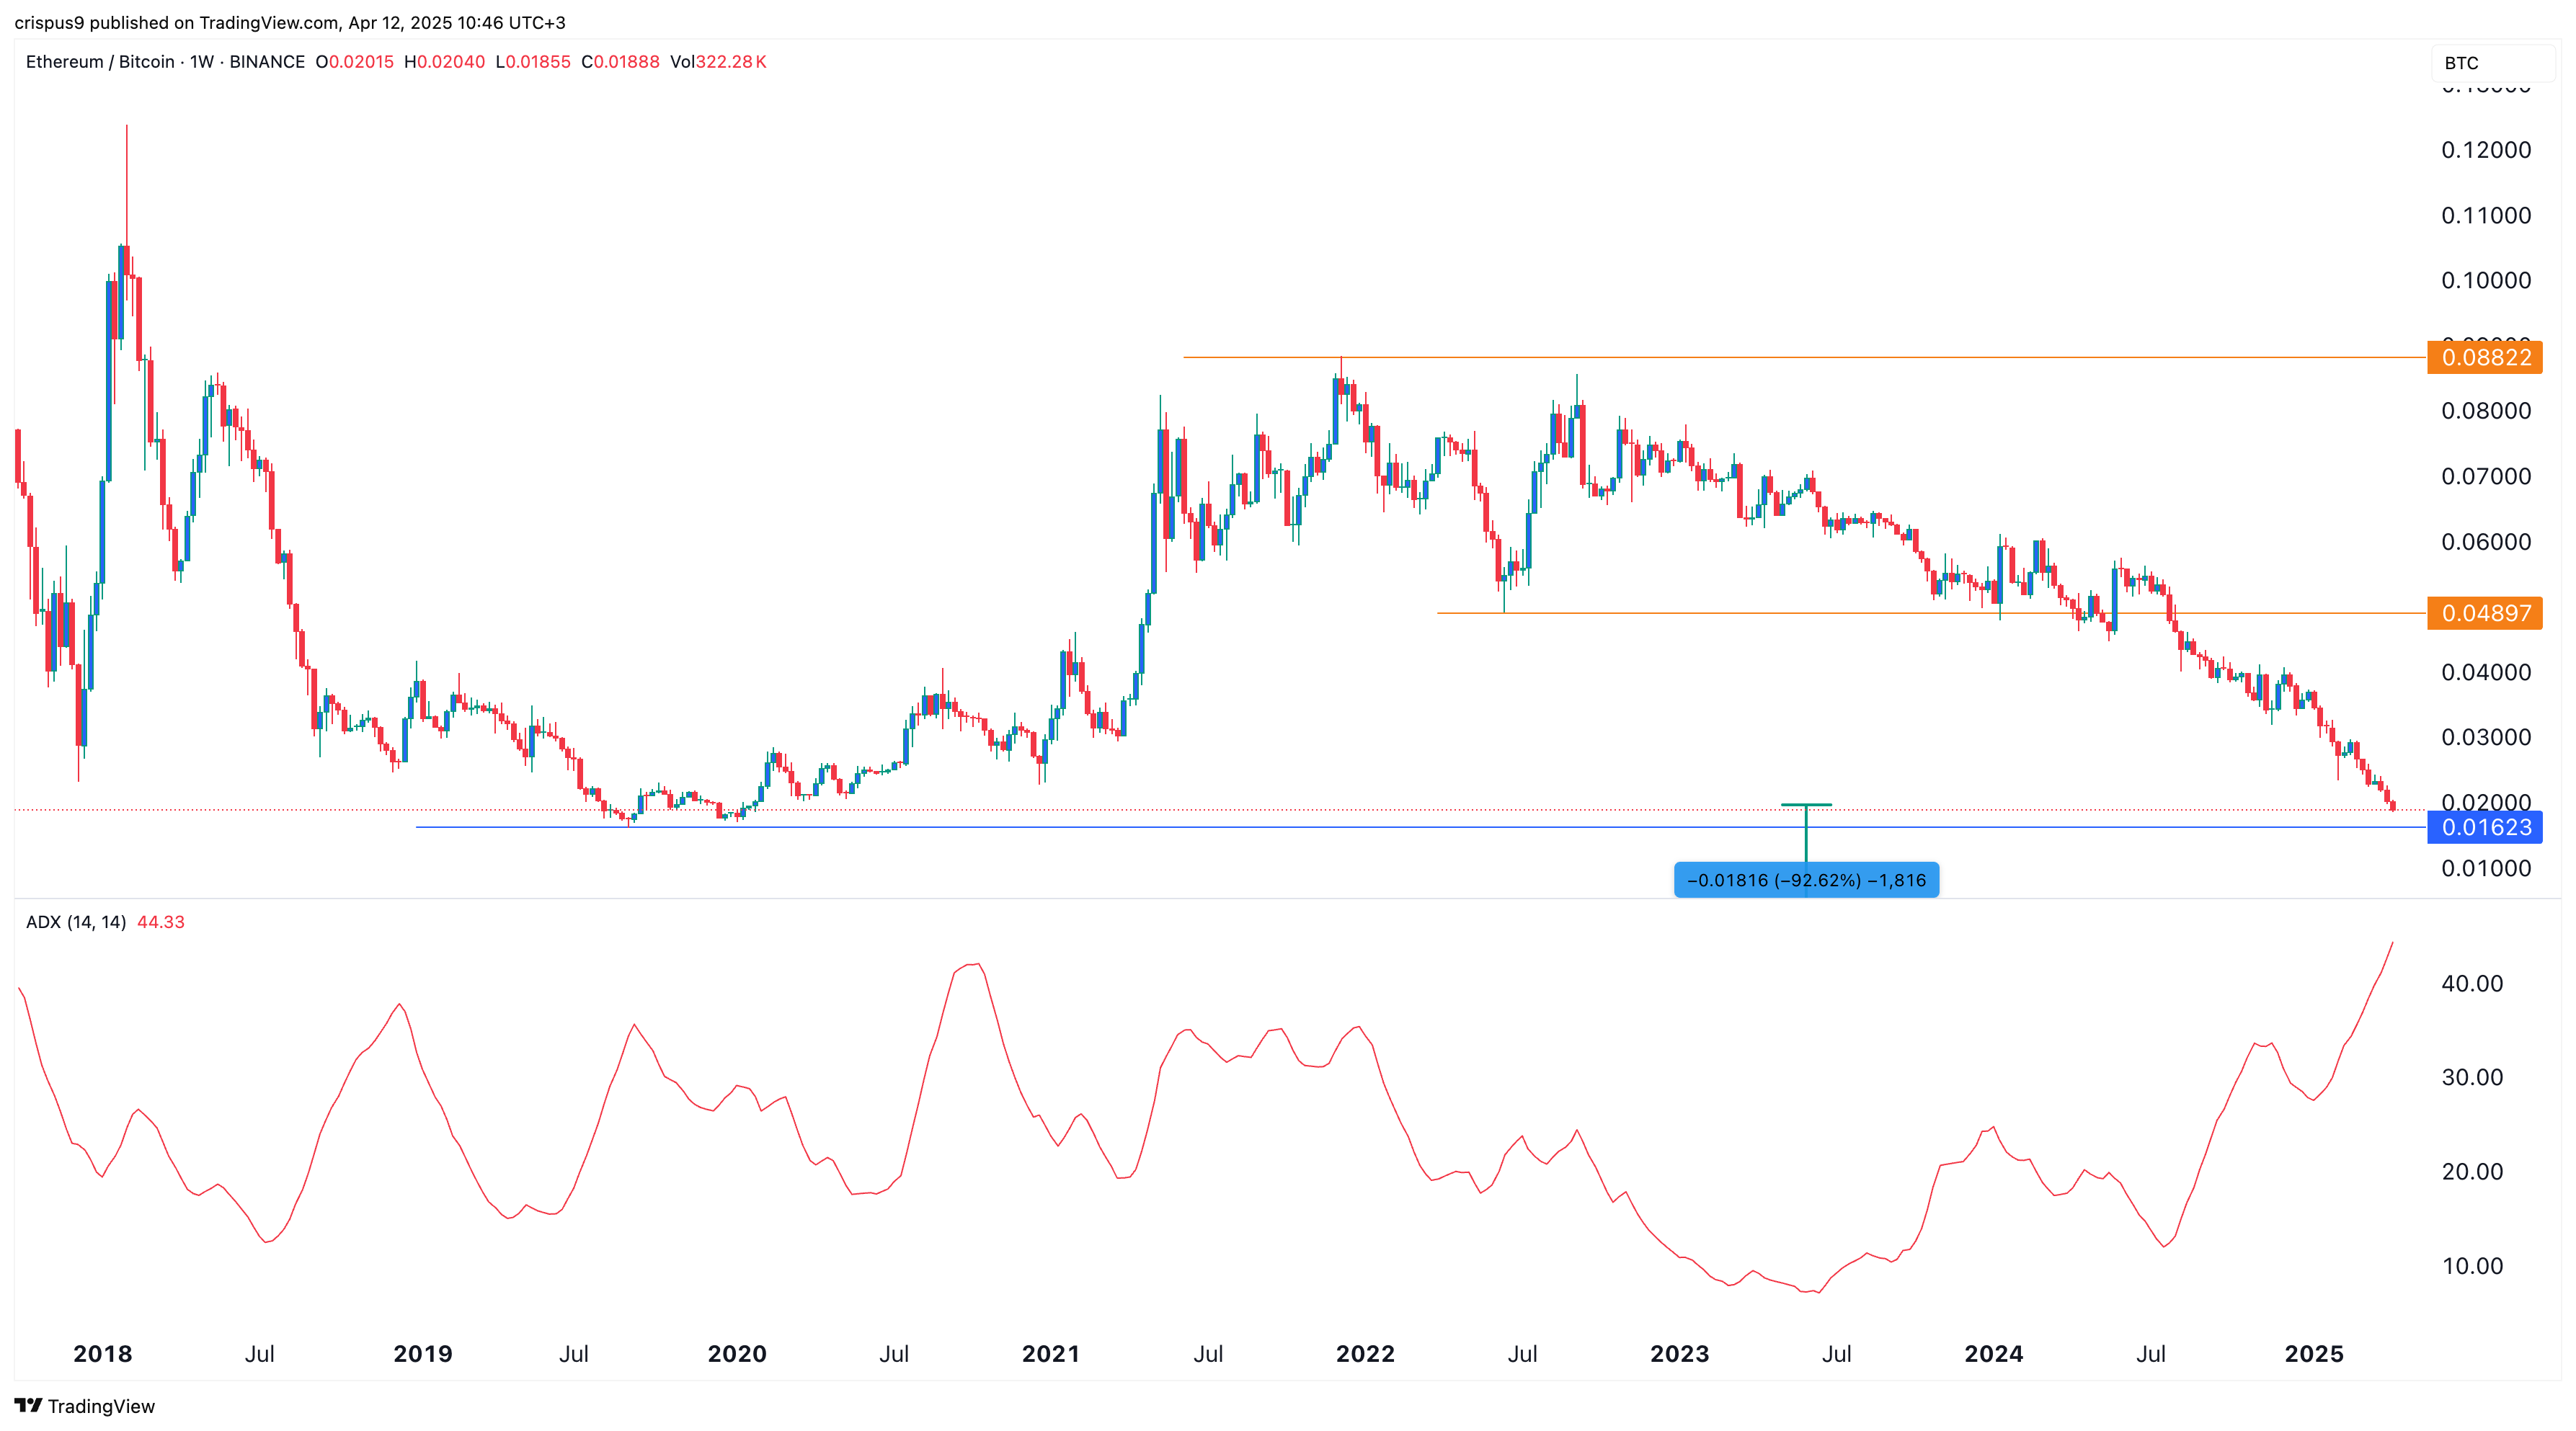
While the ETH price in USD terms looks unfavorable, the ETH/BTC valuation appears even worse. The weekly chart indicates that the ETH/BTC pair has been on a steep downtrend, plunging from 0.088 in 2021 to its current level of 0.0188. It has reached its lowest point in five years as Ethereum’s market dominance dwindles.
The pair remains significantly below all moving averages, and the Average Directional Index has surged to 44, an indicator frequently employed to assess trend strength.
Consequently, the pair is likely to continue its downward trajectory as sellers focus on a critical support level at 0.016, which is down 92% from the current price and corresponds to its lowest point since September 2019.