- Bitcoin’s price is nearing its significant resistance level at $85,000 on Monday, and a breakout could signal an upward trend in the near future.
- Ethereum’s price is hovering around $1,600 after rebounding from its daily support last week.
- XRP’s price stabilized around $2.14 on Monday, having received support from its 200-day EMA last week.
Bitcoin (BTC) is approaching a crucial resistance level at $85,000 this Monday, with a potential breakout suggesting a bullish trend might follow. Meanwhile, Ethereum (ETH) and Ripple (XRP) secured support at key levels last week, indicating a possible recovery.
Bitcoin may surge toward $90,000 if it surpasses its 200-day EMA
Bitcoin’s price broke through and closed above its descending trendline—connected by a series of highs since mid-January—on Friday, followed by a 2.22% increase the next day. However, it experienced resistance at the $85,000 level on Sunday, coinciding with the 200-day Exponential Moving Average (EMA) and daily resistance. As of Monday, it is trading at approximately $84,000.
If BTC successfully breaks and closes above $85,000, it could propel towards the significant psychological milestone of $90,000. A close above this threshold could lead to an additional rally aiming for the March 2 high of $95,000.
The Relative Strength Index (RSI) on the daily chart is flattening around the neutral level of 50, suggesting uncertainty among traders. For the bullish momentum to remain intact, the RSI needs to rise above this neutral zone.
BTC/USDT daily chart
If BTC fails to close above $85,000 and persists in its downward trajectory, it could decline to retest the next daily support level at $73,072.
Ethereum’s price could rebound if it closes above $1,700
Last week, Ethereum’s price found support at its daily level of $1,449, showing a slight recovery, but it encountered resistance around $1,700. As of Monday, it is hovering around $1,638.
If ETH continues to recover and closes above $1,700, it may further its rally to retest the next daily resistance at $1,861.
The RSI on the daily chart currently reads 42 after bouncing from an oversold level of 30 last week. It is trending upward towards the neutral point of 50, indicating that bearish momentum is diminishing. For bullish momentum to hold, the RSI needs to exceed its neutral level of 50.
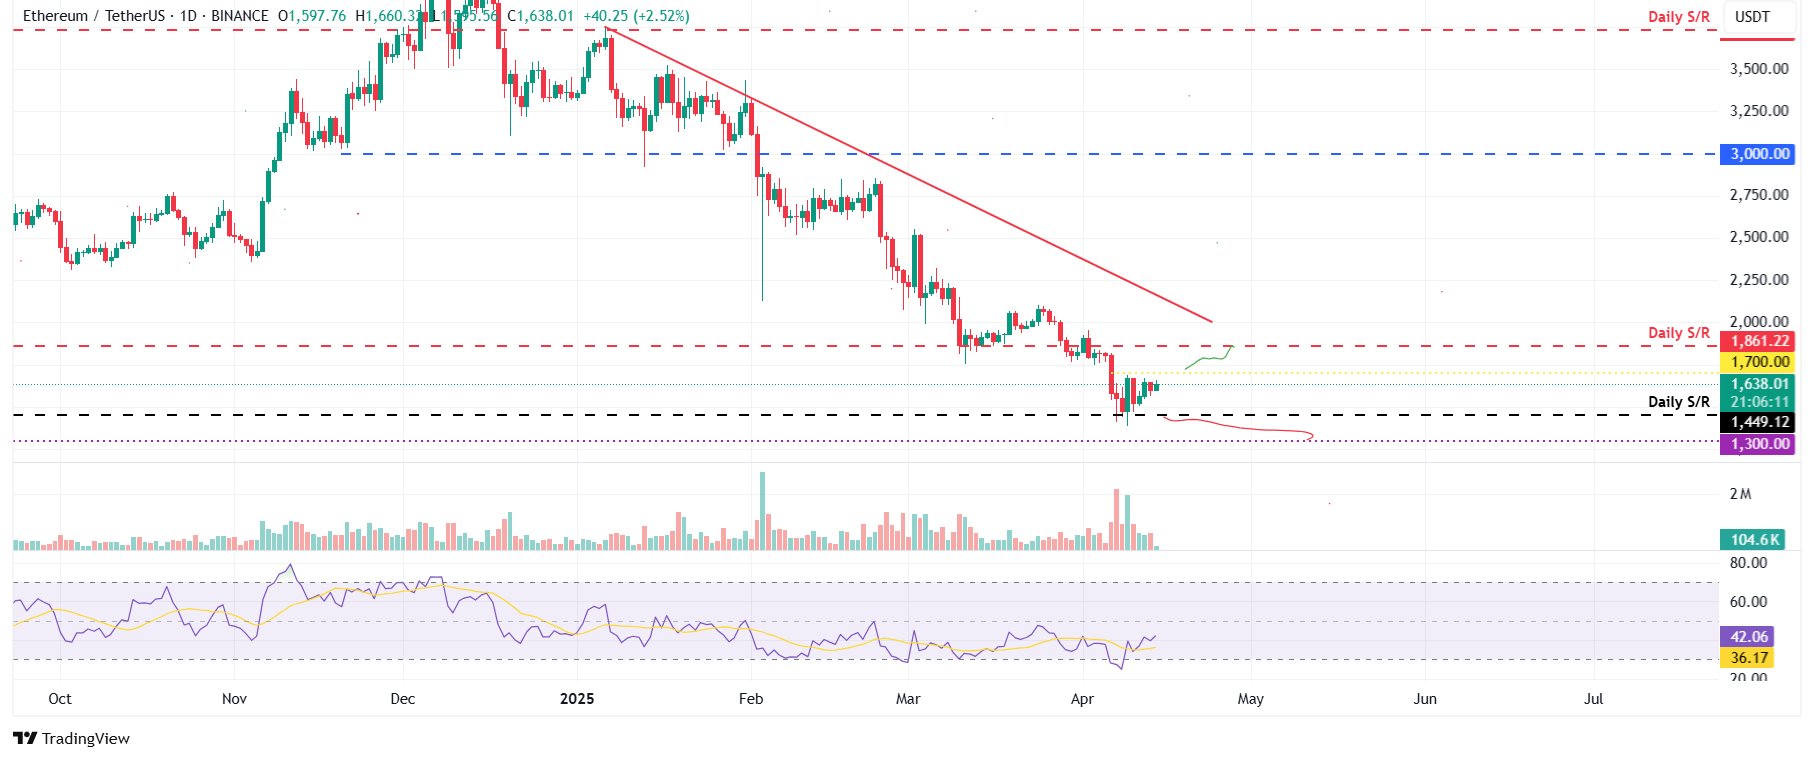
ETH/USDT daily chart
XRP bulls target the $2.50 mark
XRP’s price rose by 14.28% after breaking above its 200-day EMA at $1.95 on Wednesday. It saw a decline of 4.24% the following day, testing the 200-day EMA level. XRP then resumed its upward trend and retested its April 2 high of $2.23 on Sunday. As of Monday, it is stabilizing around $2.14.
If XRP breaks and closes above $2.23, it could further its rally toward the March 24 high of $2.50.
The RSI on the daily chart is at 50 and is trending upward, indicating that bearish momentum is fading. To sustain the recovery rally, the RSI needs to remain above 50.
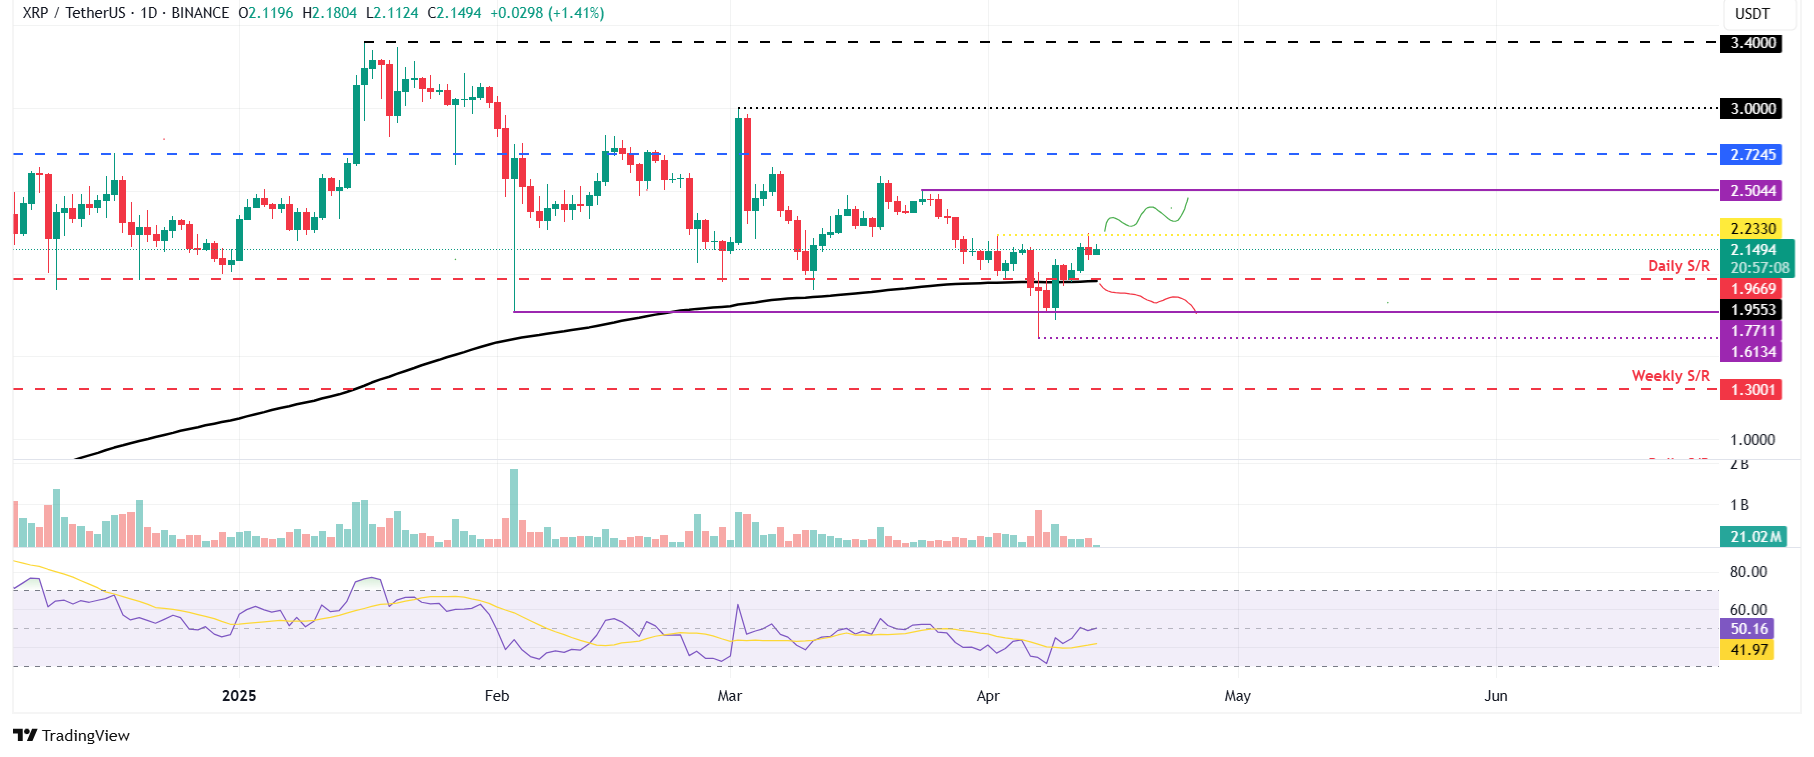
XRP/USDT daily chart
If XRP closes below its 200-day EMA, it could drop further to retest the next support level at $1.77.
Bitcoin, altcoins, stablecoins FAQs
Bitcoin stands as the largest cryptocurrency by market capitalization, functioning as a quasi-currency. This digital form of payment operates without the control of any individual, group, or entity, thus negating the need for intermediaries in financial transactions.
Altcoins encompass all cryptocurrencies excluding Bitcoin, although some consider Ethereum as a non-altcoin due to the fact that these two cryptocurrencies are the primary sources for forking. If this view holds, Litecoin would be identified as the first altcoin, having forked from Bitcoin’s protocol and hence being seen as an “enhanced” version.
Stablecoins are cryptocurrencies intended to maintain a stable price, backed by a reserve of the asset they represent. To achieve this, each stablecoin’s value is pegged to a commodity or financial instrument, like the US Dollar (USD), with its supply managed through an algorithm or based on demand. The primary objective of stablecoins is to provide an entry/exit point for investors participating in the cryptocurrency market. They also allow for value storage, as cryptocurrencies in general are known for their volatility.
Bitcoin dominance refers to the ratio of Bitcoin’s market capitalization to the total market capitalization of all cryptocurrencies together. This metric illustrates Bitcoin’s popularity among investors. Typically, a high Bitcoin dominance occurs during bullish phases, as investors tend to favor stable, major market-cap cryptocurrencies like Bitcoin. Conversely, a drop in Bitcoin dominance indicates that investors might be reallocating their funds and profits toward altcoins in search of higher yields, often triggering significant rallies in those altcoins.