- OM token of Mantra crashes by an astonishing 90% on Sunday due to insider trading allegations.
- Concerns of a potential pump-and-dump scheme arise as the Mantra team reportedly controls 90% of the token supply.
- The team from Mantra denies any insider dumping, claiming the price drop results from reckless liquidations.
- Following a dramatic drop from $6.33, OM is now trading at $0.83.
The price of Mantra’s OM token hovered around $0.83 during the Asian trading hours on Monday, after experiencing a monumental 90% decline from $6.33 on Sunday. This collapse erased $5.2 billion from the token’s market cap, leading many to draw parallels with the notorious collapses of Terra LUNA and FTX in 2022. Allegations of insider trading have been leveled against the Mantra team, amidst questionable token transactions.
Mantra’s price collapse: Insider trading or reckless liquidations?
Mantra, a blockchain designed for real-world assets (RWA) focused on security for institutions and developers, finds itself under scrutiny after its native OM token plummeted 90% on Sunday. This decline triggered $68.86 million in liquidations within a 24-hour period, with long positions taking the brunt at $49.68 million, while shorts incurred losses of $19.18 million, based on Coinglass data.
Data on liquidations
Numerous voices in the crypto community have expressed doubt regarding the sudden crash, with some asserting that the Mantra team holds 90% of the token supply and that they may have orchestrated the sell-off.
A report from SpotOnChain, a service that tracks cryptocurrency transactions, indicated that a cluster of OM investors transferred 14.27 million OM—around $91 million—to OKX just three days prior to the crash at an average price of $6.375. Furthermore, these same investors purchased 84.15 million OM, roughly $564.7 million, on Binance in March at an average price of $6.711.
Even though the valuation of their remaining holdings of 69.08 million OM has plummeted to $62.2 million, SpotOnChain suggested that “they may have hedged their positions elsewhere, and it’s conceivable they contributed to the sharp decline.”
Lookonchain, another wallet tracking service, highlighted that at least 17 wallets moved 43.6 million OM, amounting to about $227 million at the time, to exchanges. This considerable transfer constituted 4.5% of the Mantra token’s supply. According to Arkham’s information, two of these addresses are directly associated with Laser Digital, a strategic investor in Mantra.
Who triggered the price drop for $OM? Before the $OM crash (beginning April 7), at least 17 wallets deposited 43.6M $OM ($227M at the time) into exchanges, representing 4.5% of the circulating supply. According to Arkham’s records, 2 of these addresses are connected to Laser Digital.
Laser Digital is a strategic… pic.twitter.com/zB8yAPRPSO
— Lookonchain (@lookonchain) April 14, 2025
In light of the allegations, the Mantra team emphasized the project’s robust fundamentals. They claimed that the events leading to the crash were due to “reckless liquidations” and that it was not connected to their management decisions.
To the MANTRA community: we want to assure you that MANTRA is fundamentally strong. Today’s market activity was driven by reckless liquidations, unrelated to the project’s management. We are currently investigating and will provide further updates…
— MANTRA | Tokenizing RWAs (@MANTRA_Chain) April 13, 2025
What lies ahead for Mantra?
The precise factors contributing to the significant crash remain uncertain, leaving many traders and investors grappling with deeper losses amid the ongoing turmoil. The Mantra team has committed to an inquiry and will offer more insights into the situation.
Thus far, a confluence of elements, including structural weaknesses, the team’s alleged dominance over the supply, hefty token deposits to exchanges, over-the-counter (OTC) transactions, and aggressive liquidations, may have triggered the downfall.
Currently, the OM token appears to be significantly oversold according to the Relative Strength Index (RSI), indicating bearish control as bullish momentum diminishes on Monday. The Moving Average Convergence Divergence (MACD) supports the ongoing downtrend, remaining at -0.3007.
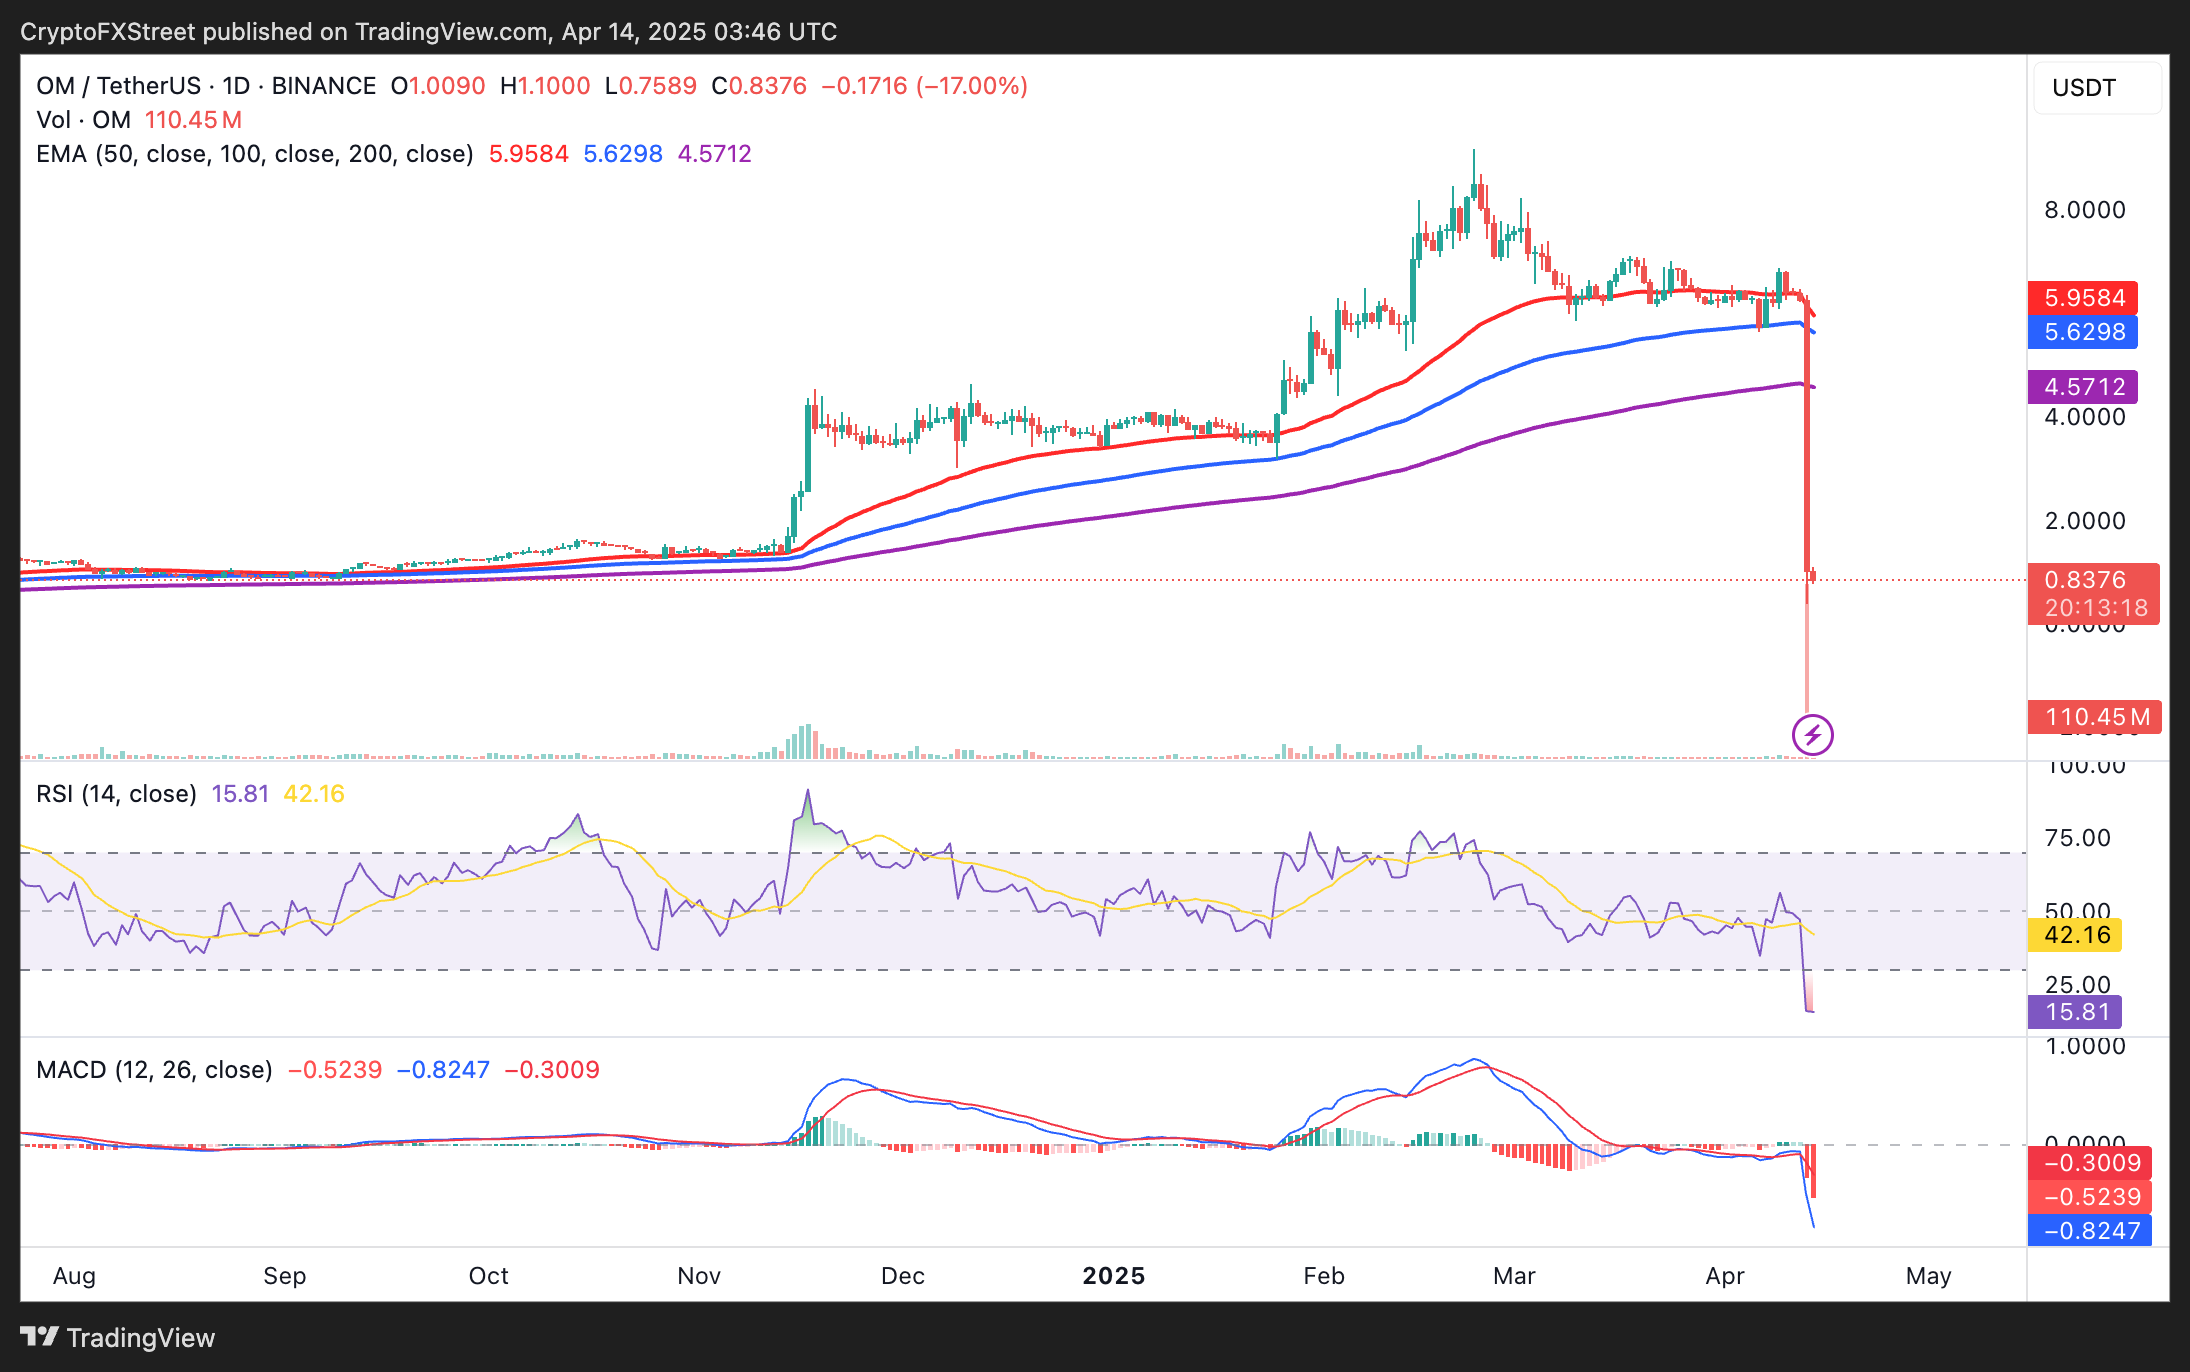
Daily chart for OM/USDT
The following days will be pivotal for Mantra’s trajectory, suggesting that traders might want to adopt a patient approach. A forthcoming report from the team could illuminate the reasons behind the sharp decline in OM prices, potentially setting the stage for a recovery. However, it is wise to prepare for various outcomes, including a continued decline, while being mindful of rising concerns regarding market manipulation.