The native cryptocurrency of Ethereum, Ether (ETH), remains stagnant beneath the $2,000 mark, which some traders perceive as a significant psychological threshold. On March 10, the price of Ether dipped below this range, and it has continued to trade at its lowest point since October 2023.
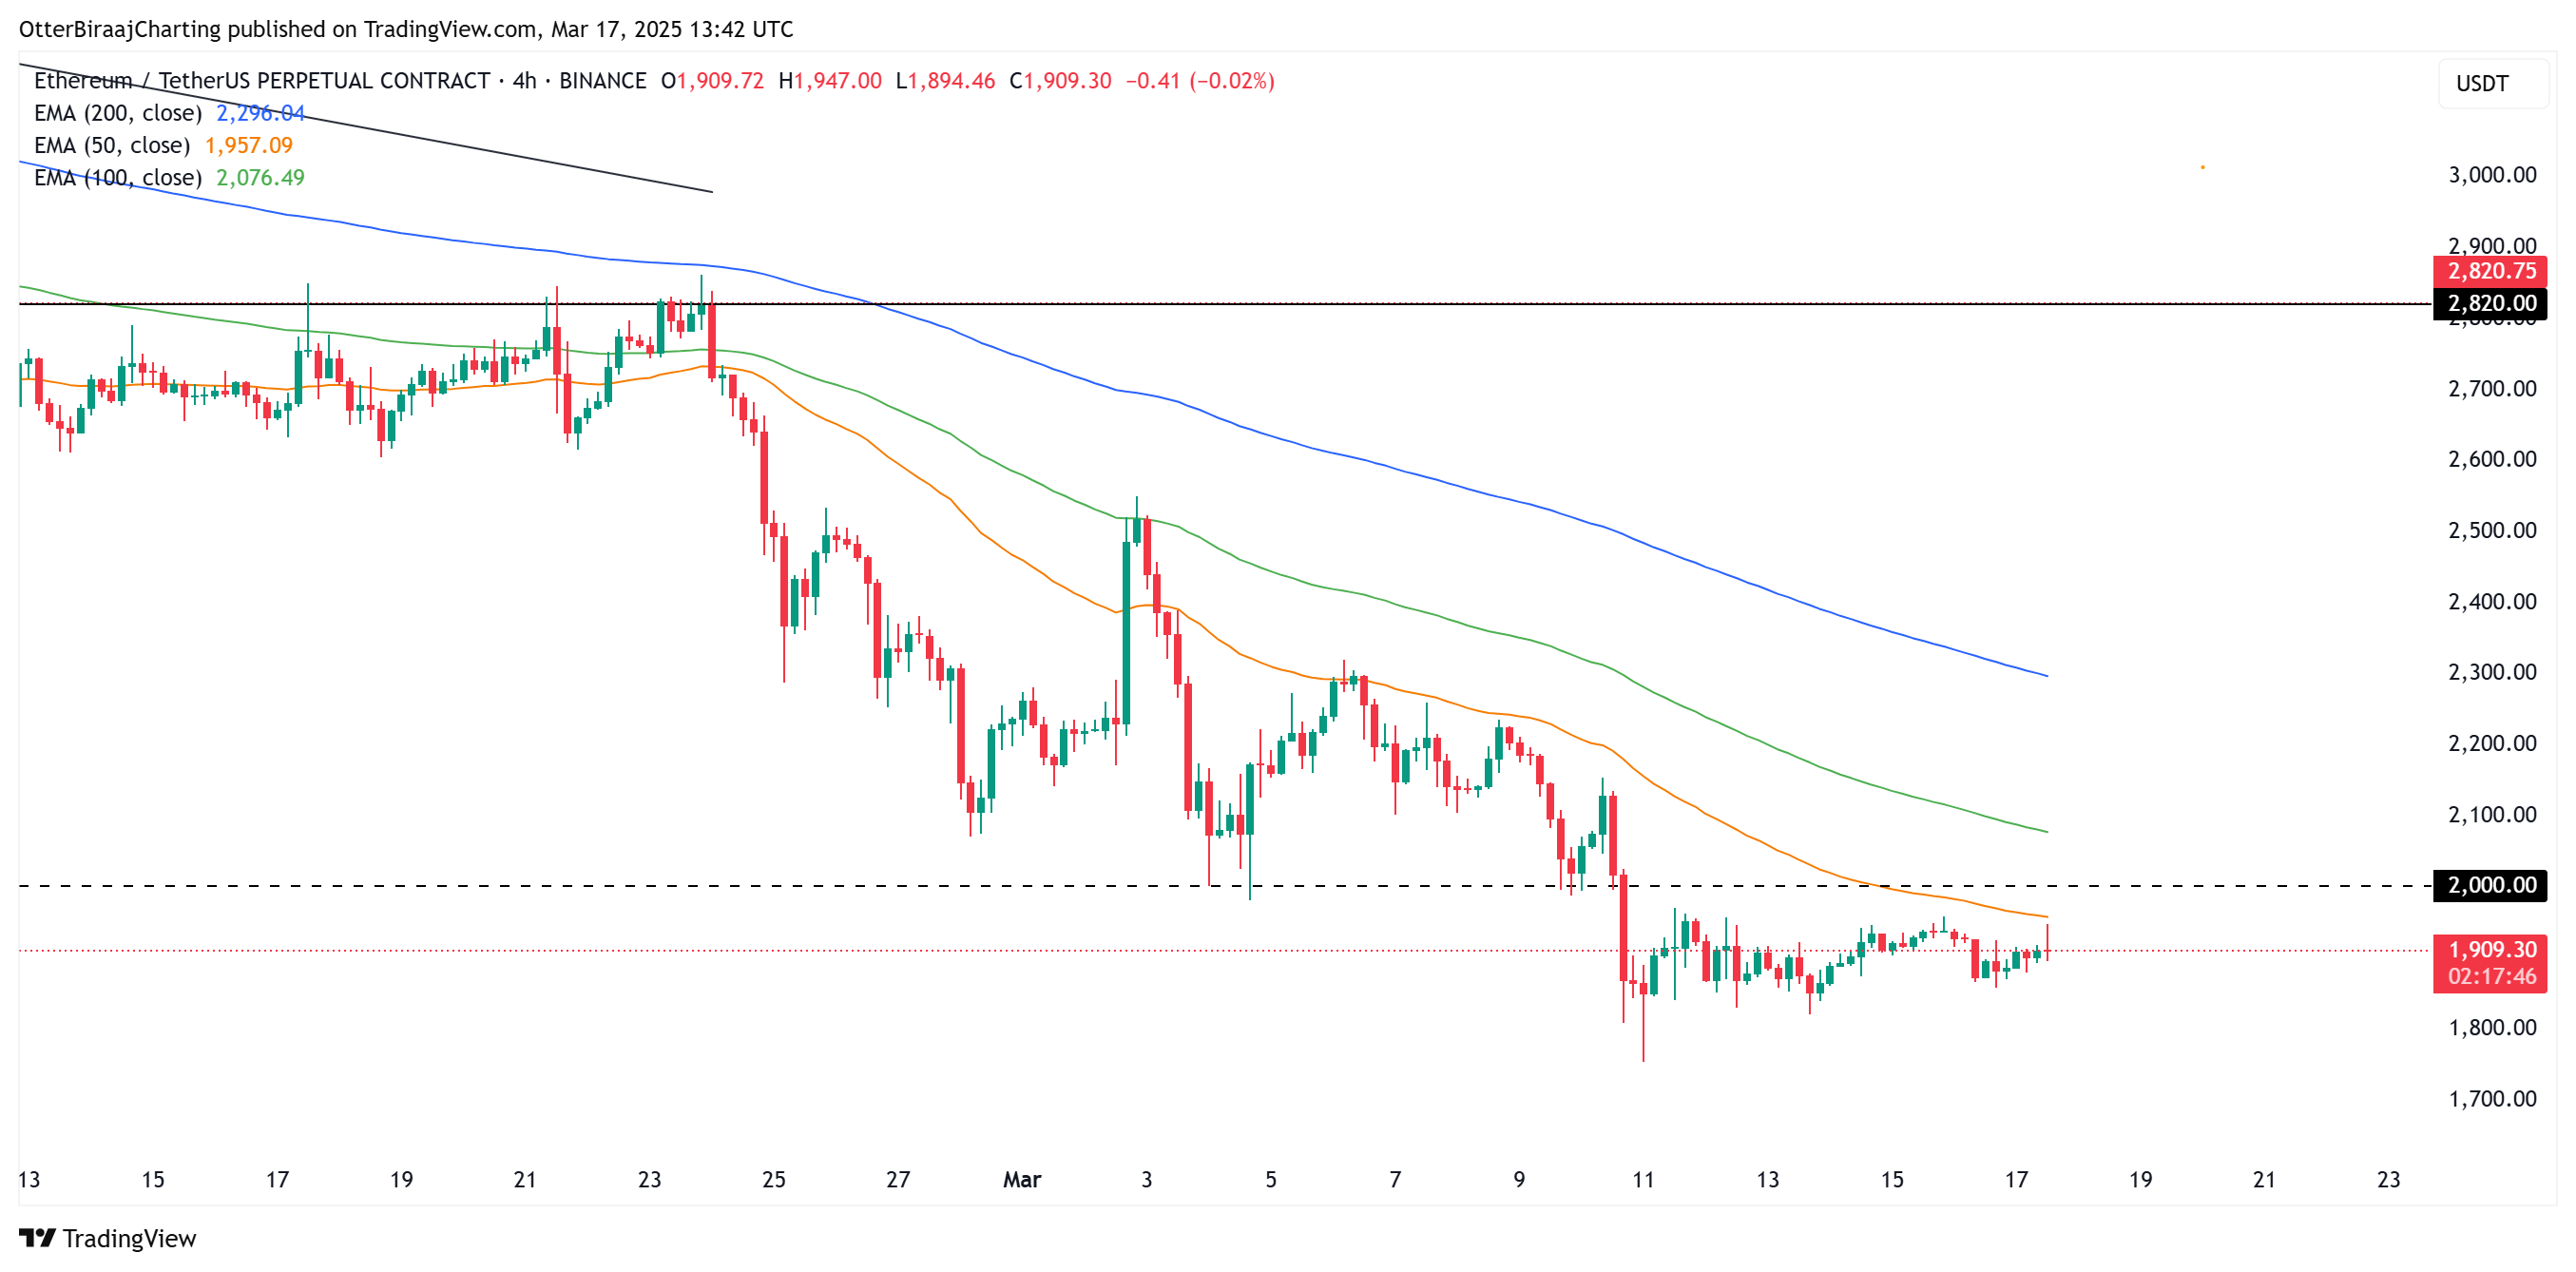
Ethereum 4-hour chart.
Ether has also seen a decline in market value relative to other major altcoins, with the price of XRP reaching its highest point against ETH in five years on March 15.
The primary concern for investors now is whether ETH can regain some of its recent declines, or if there will be significant selling pressure should the price dip below $1,900.
Traders may exit if the price falls beneath $1,900
As per analytics data, Ethereum holders amassed 3.56 million ETH when prices ranged from $1,900 to $1,843, averaging around $1,871. This collective investment amounts to roughly $6.65 billion. Consequently, there appears to be robust support for ETH’s price in the $1,900 to $1,843 range, which could serve as a potential bullish reversal zone.
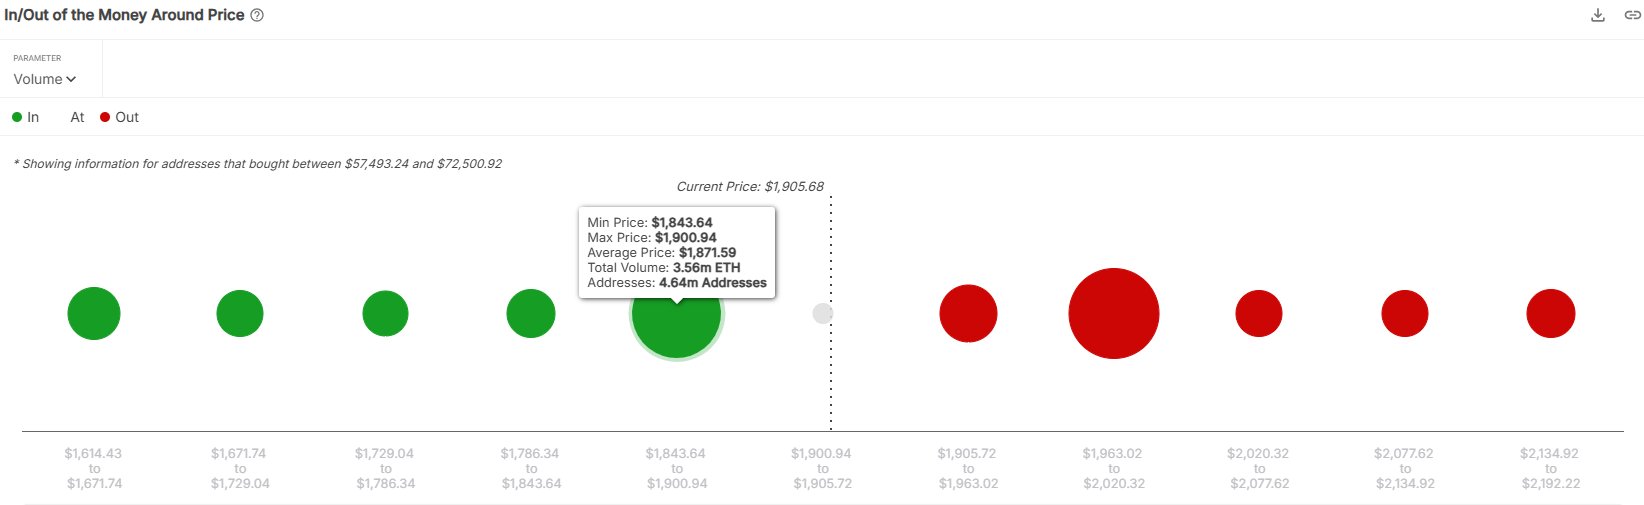
Ethereum In/Out of the Money chart.
However, should Ether fall below $1,843, there may be an uptick in capitulation risks. Capitulation refers to a market sentiment where investors panic and sell their assets at losses during a downturn. Prolonged consolidation below $1,843 could significantly increase the chances of a deeper correction.
Falling below $1,843 sees a notable decrease in the size and volume of ETH accumulation, underscoring the importance of the support range between $1,900 and $1,843.
In a similar vein, the share of Ethereum addresses showing profit has reached its lowest point since early this decade, sitting at just below 46%, the lowest since December 2022.
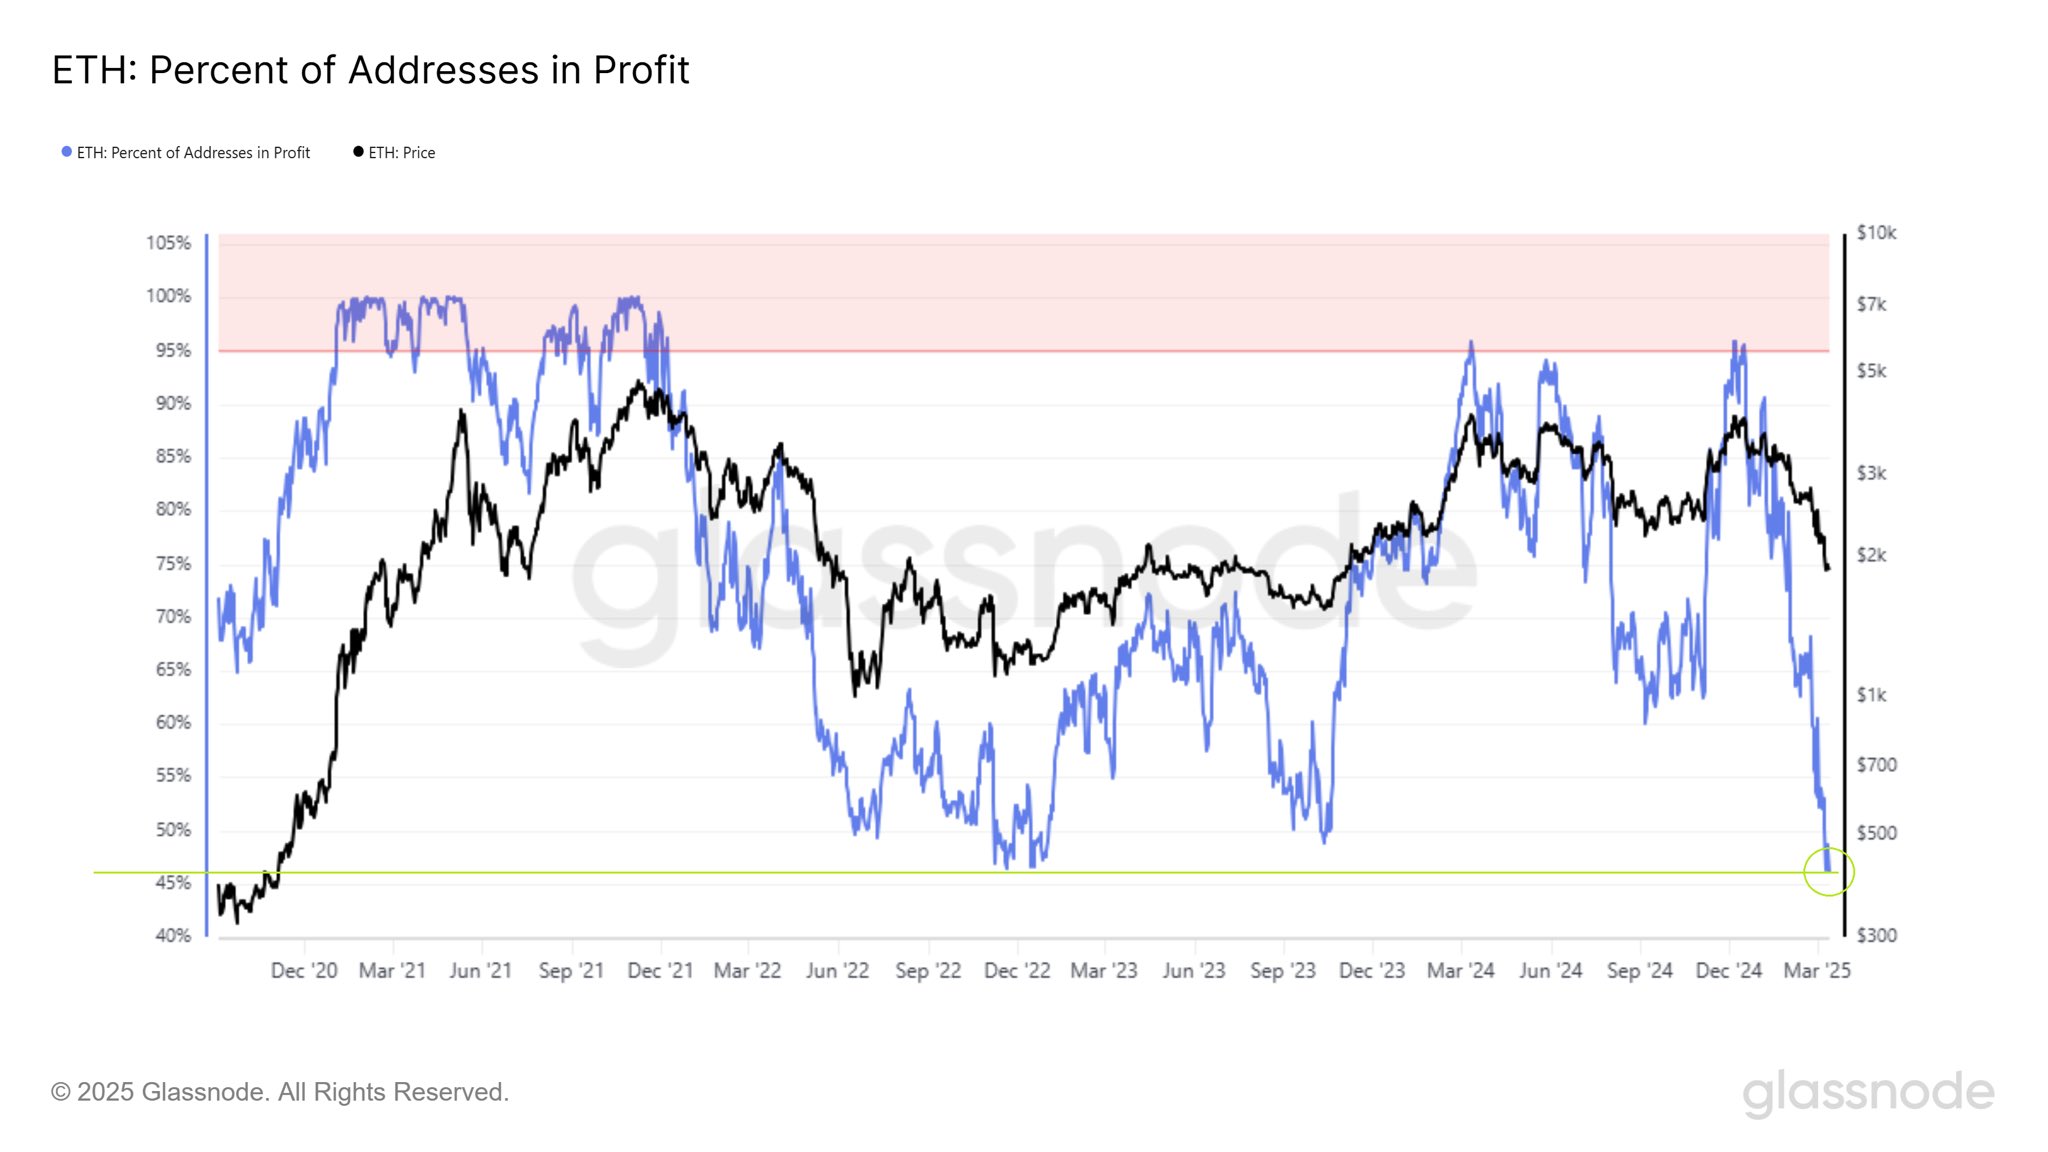
ETH: Percentage of addresses in Profit.
A low proportion of profitable addresses has historically been a signal of a potential price bottom for Ethereum. Given the strong ETH accumulation alongside a smaller number of profitable addresses, these factors might present bullish indicators. Consequently, the chances of Ethereum remaining below $1,843 long term appear to be diminishing.
Hitesh Malviya, a prominent figure in the crypto space, noted that it may not be the ideal time to adopt a bearish outlook on ETH. In a recent post, he emphasized the noteworthy growth of real-world assets (RWAs) in the industry, reporting a 50.9% increase over the last month and an 850% annual rise, with Ethereum and ZKsync commanding over 80% of the overall market share.
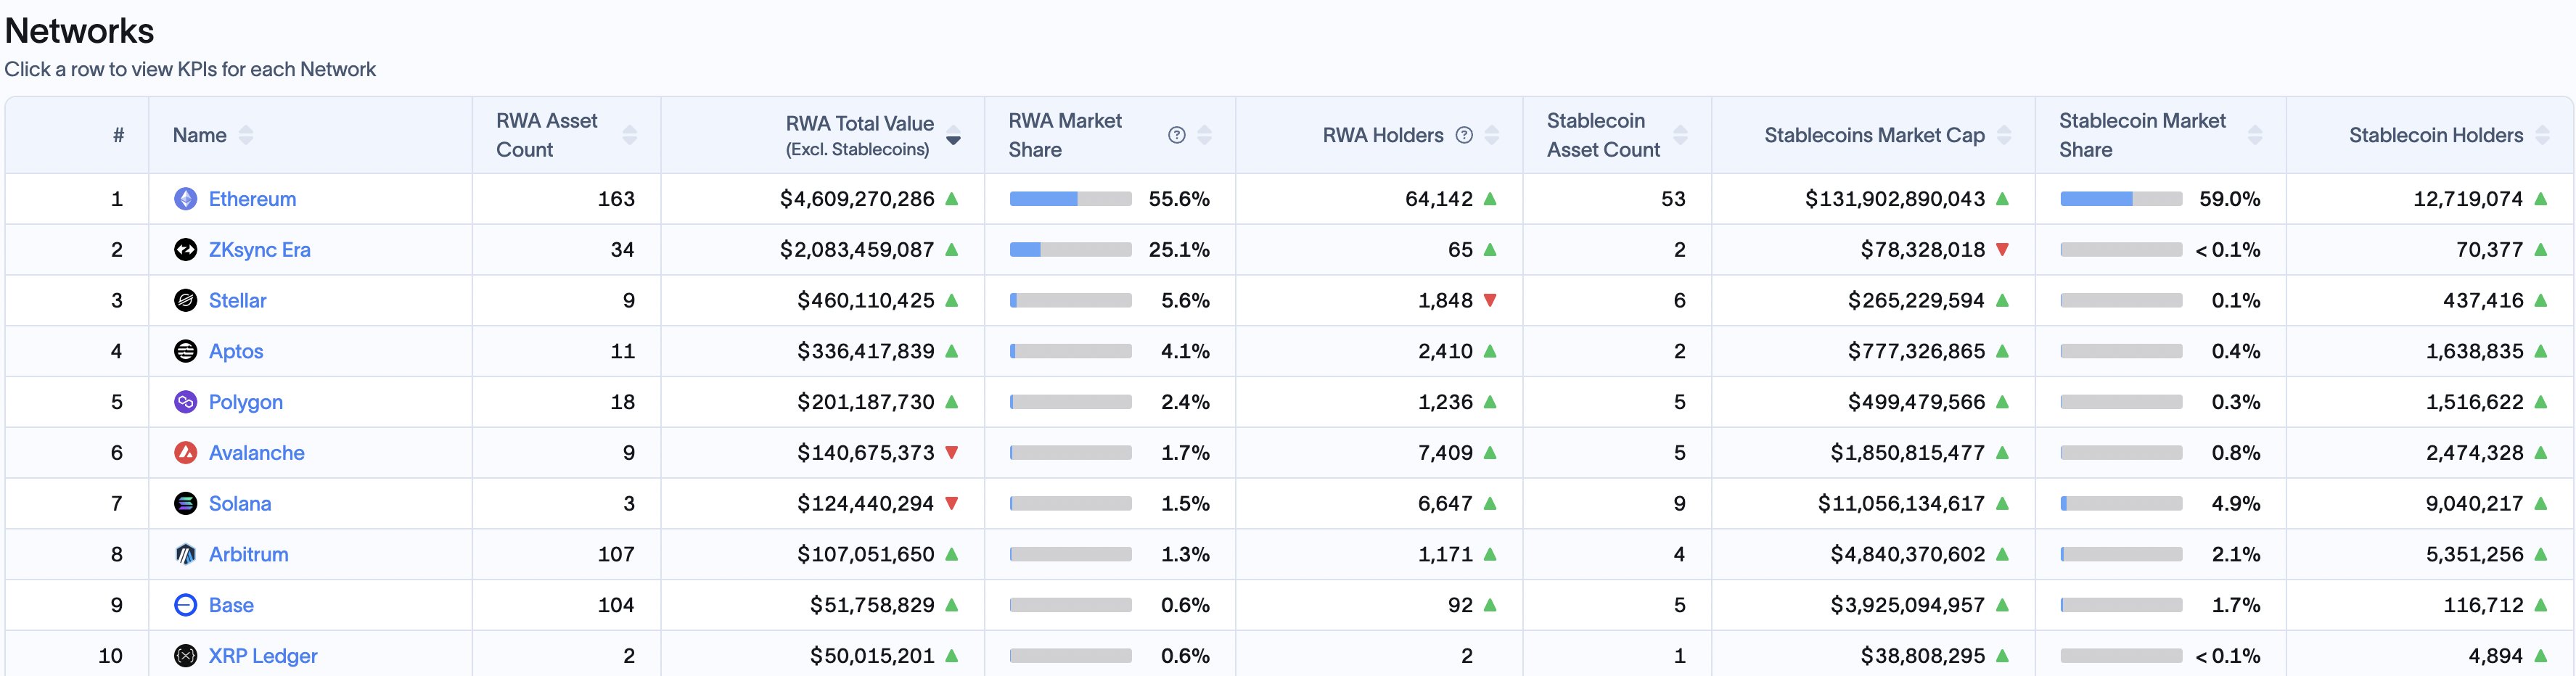
RWA’s market share on L1s.
Related: Bitcoin ‘bullish cross’ with 50%-plus average returns flashes again
Neutral market indicated by Ethereum long/short ratio
A crypto data analysis website has reviewed the current market sentiment for Ether based on the long/short ratio, which measures the number of futures traders betting on price increases (long) versus those betting on decreases (short).
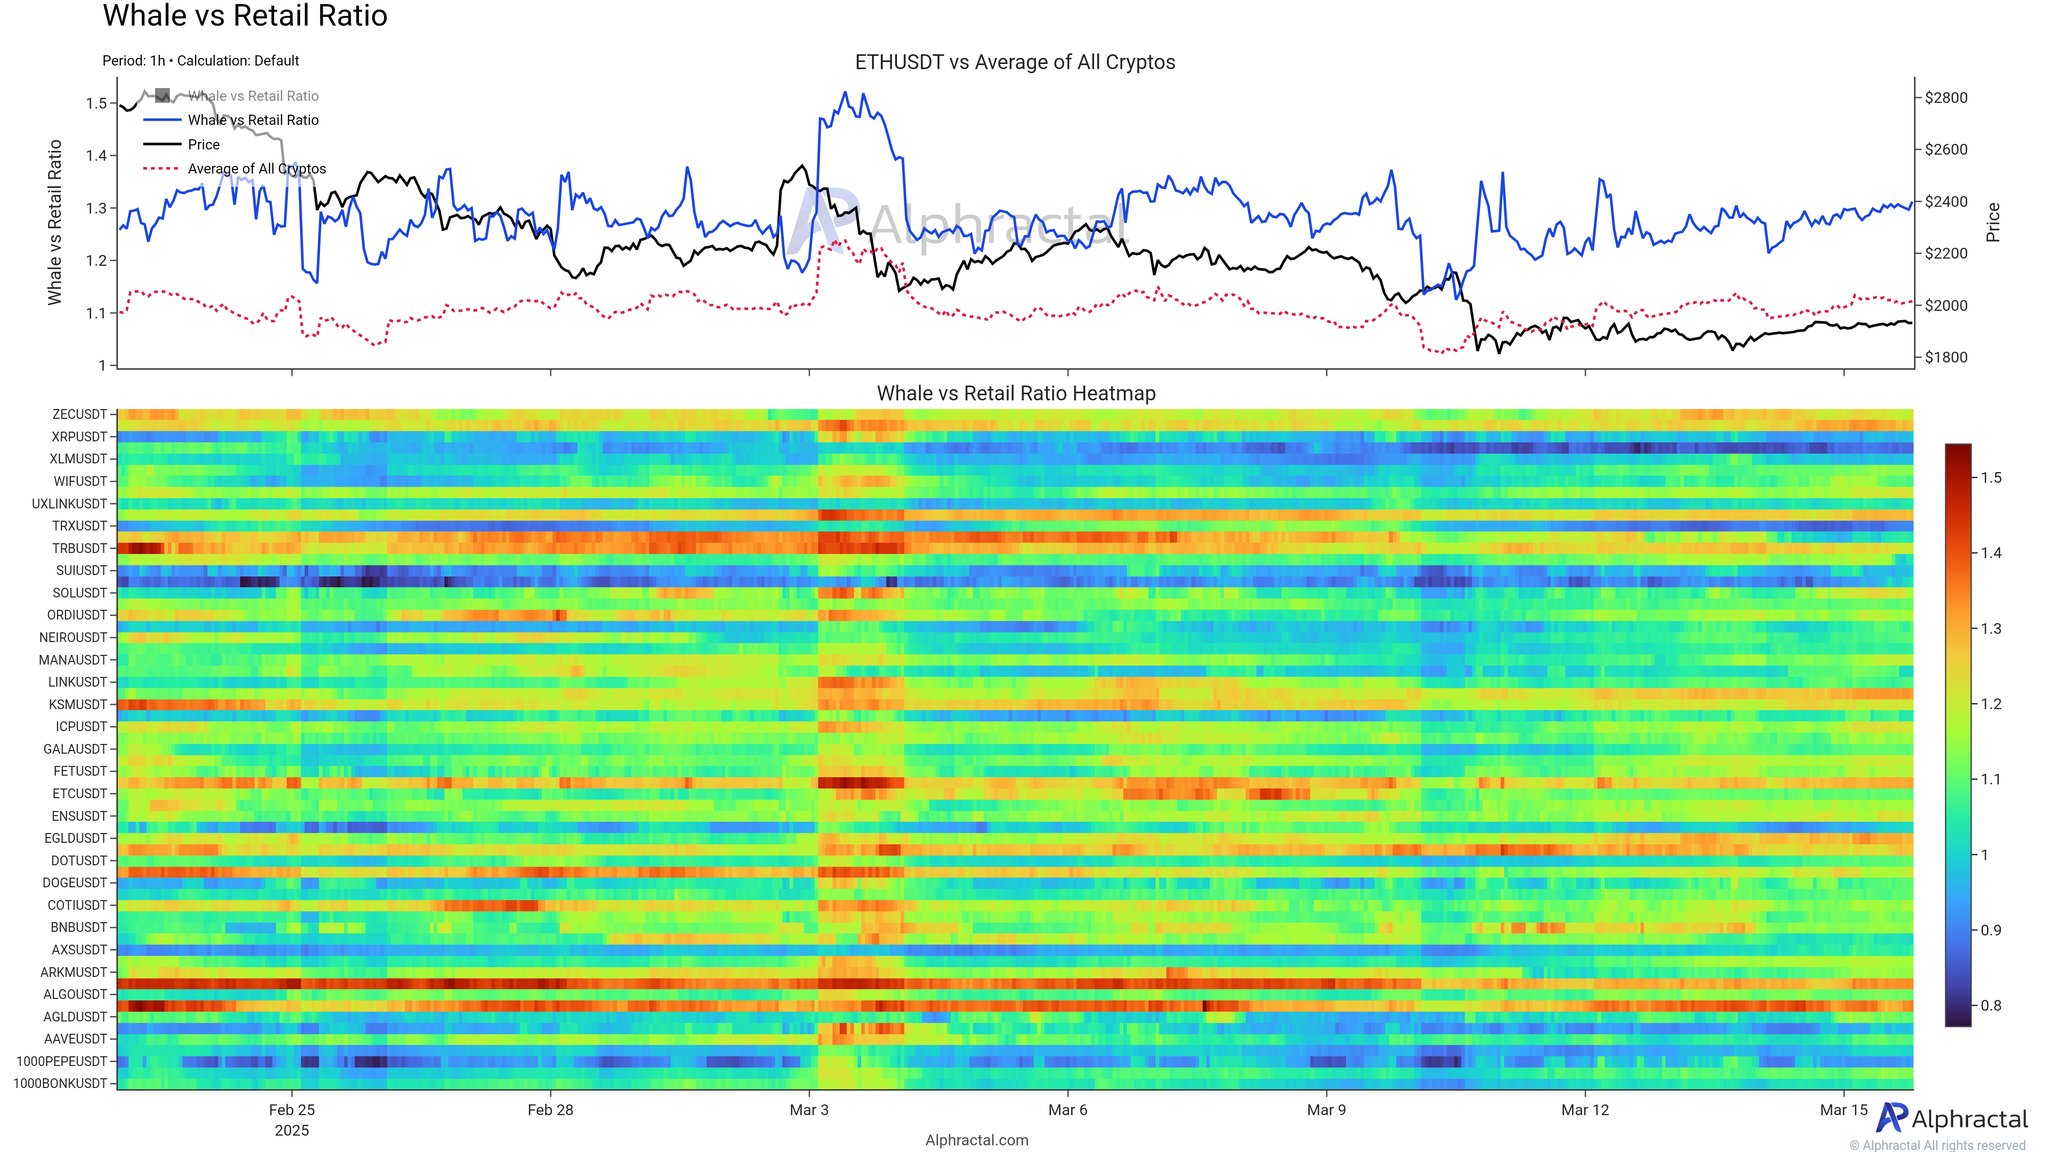
Whales vs. Retail ratio heatmap.
According to the chart, larger investors seem to be leaning towards long positions, while smaller investors are in the process of reducing their leveraged positions, which typically lessens market volatility and decreases interest in leveraging trades.
With the current long/short ratio standing at 1.3, it suggests a cautious yet balanced market atmosphere. The analysis noted,
“This indicates that, in the short term, Ethereum is experiencing low volatility and low interest in leverage, which may leave many traders feeling drained and impatient.”
Related: Ethereum on-chain data suggests $2K ETH price is out of reach for now
This article does not contain investment advice or recommendations. Every investment and trading move involves risk, and readers should conduct their own research when making a decision.